




















.webp)






















.jpg)







DAILY INSIGHTS & INTEL
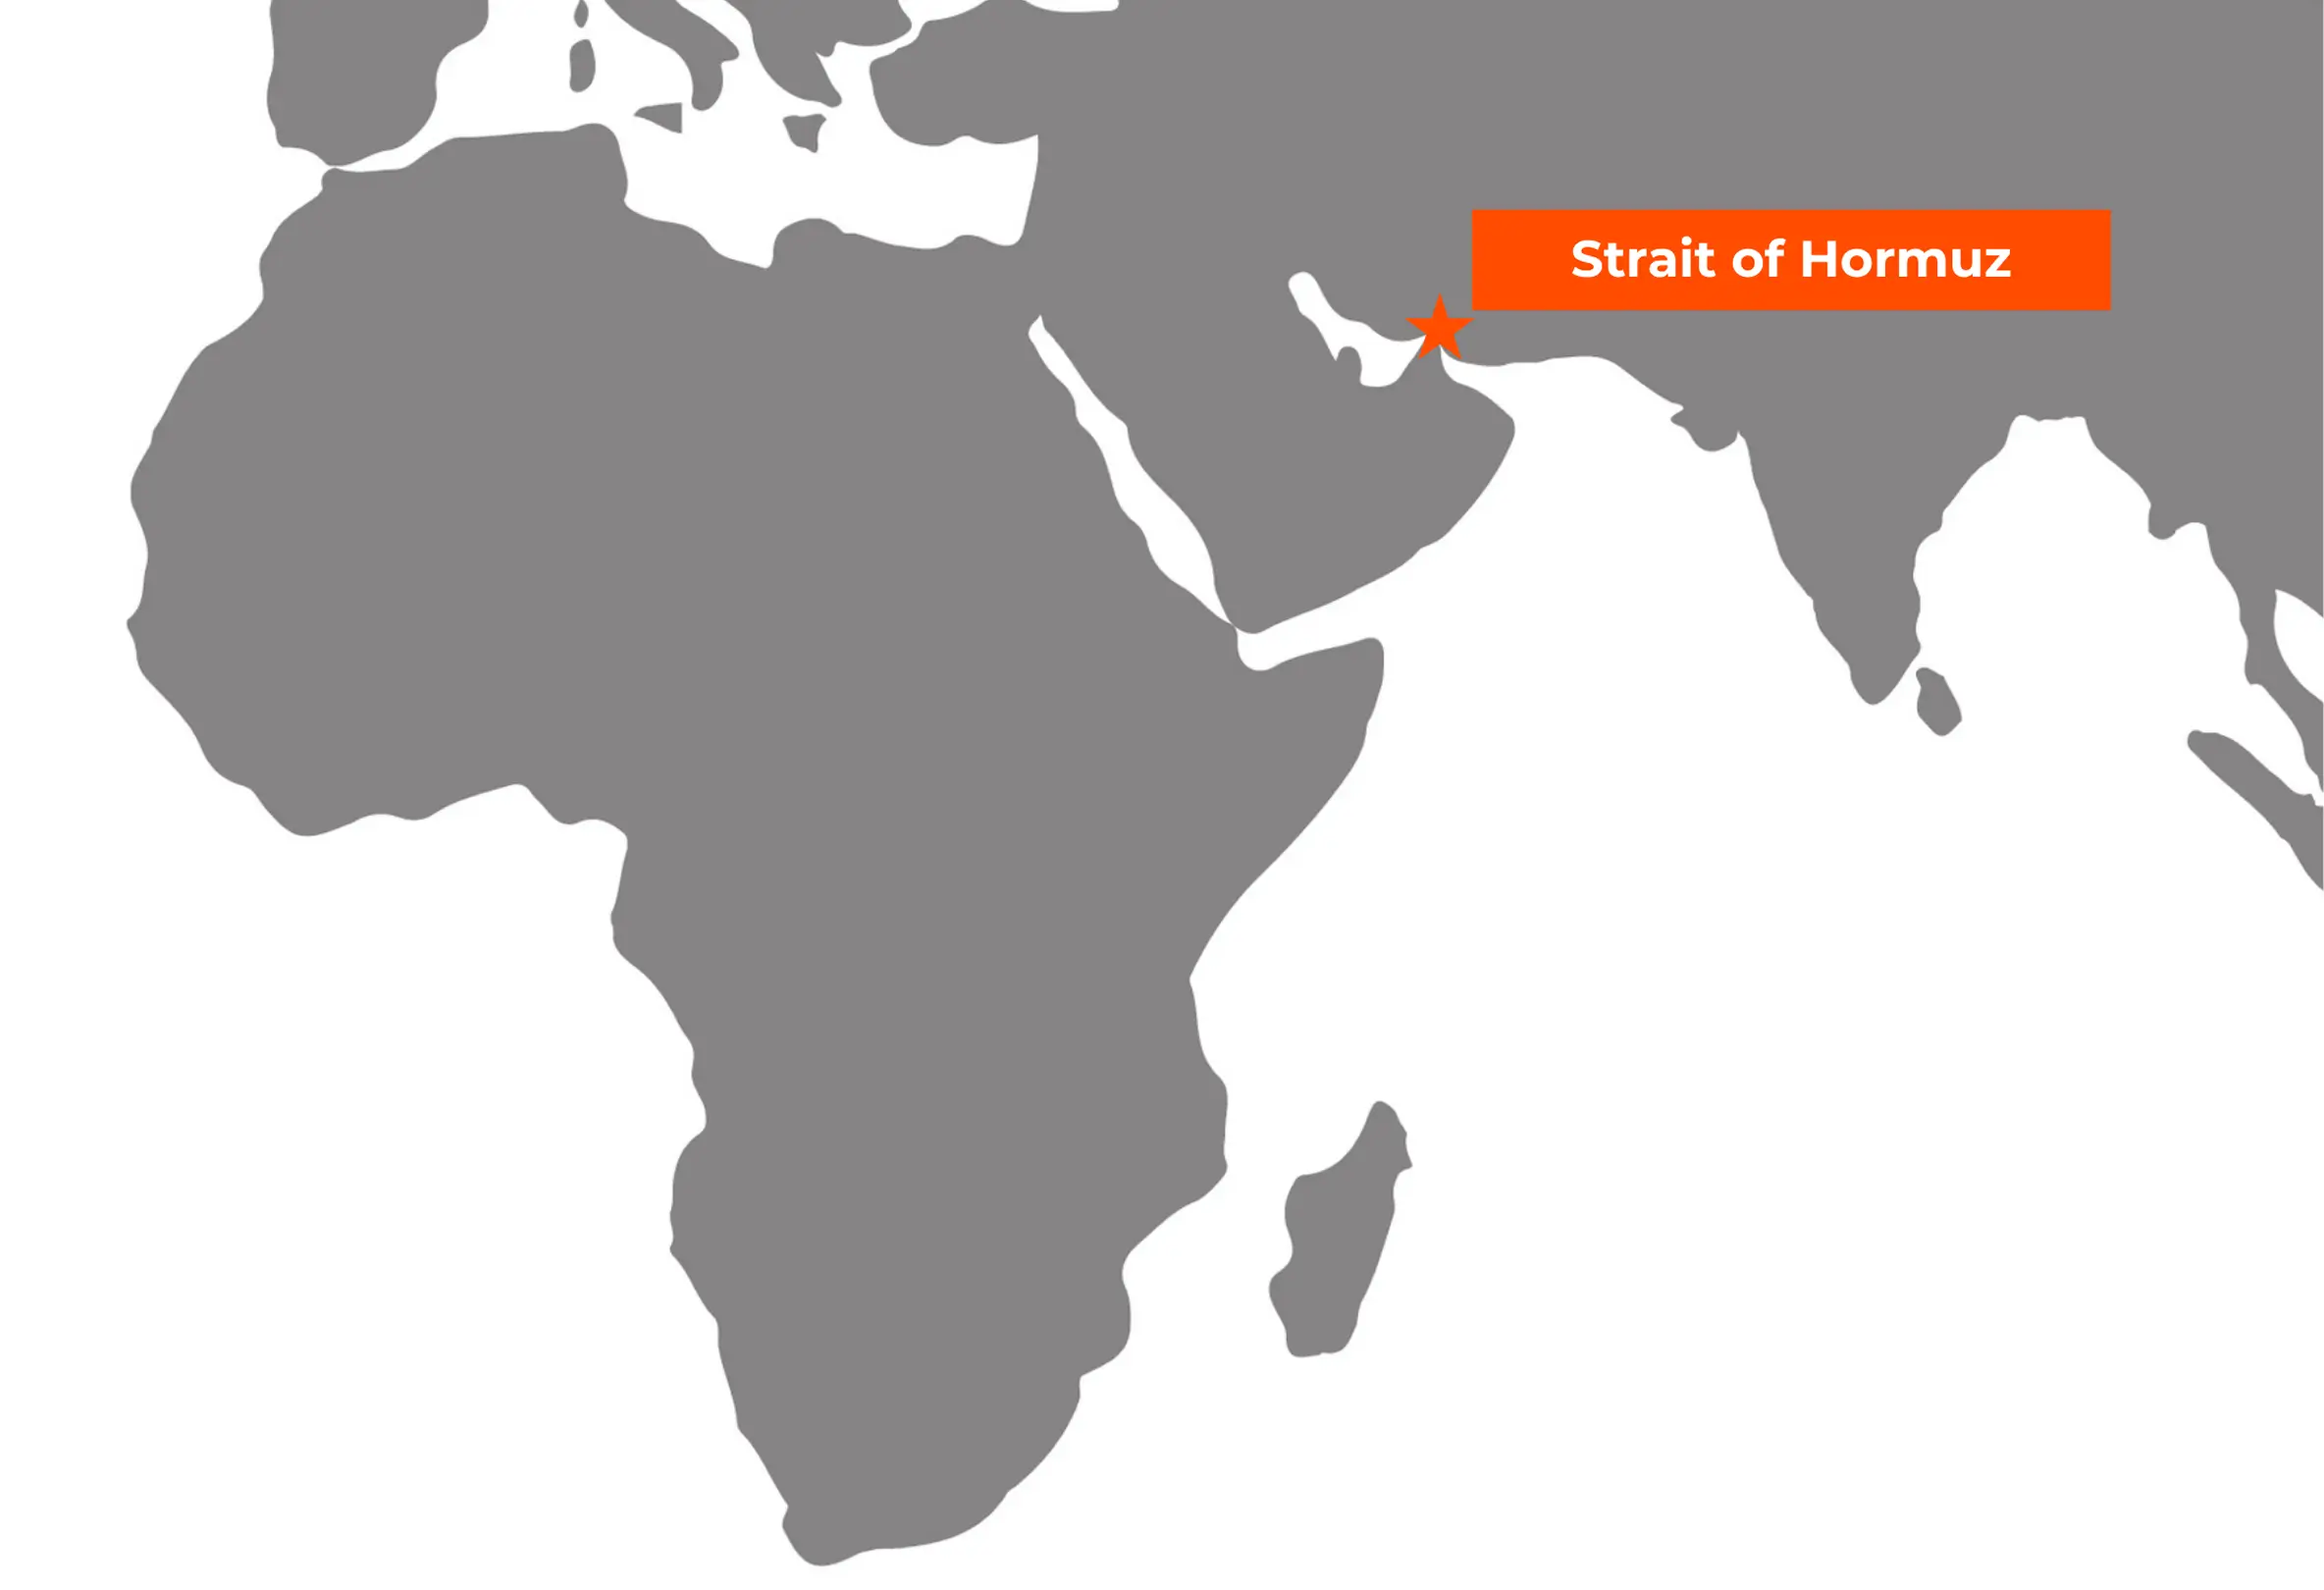
Strait of Hormuz Status at a Glance
- Vessel Traffic: .Transits reached 12 on August 16, roughly 7% of the ~178 per day baseline before the conflict, with a seven day average near 101. The June 17 memorandum's 60 day window expired August 17 with no agreement, and the U.S. naval blockade reimposed July 13 remains active2 3.
- Insurance & Shipping Economics: War risk premiums have risen to a current range of 7.5% to 10% of hull value as of July 22, up from 1% to 3% several weeks earlier and 30 to 40 times the 0.25% seen before the conflict. Brokers reported underwriters growing more reluctant to offer cover at any price, with pricing now set voyage by voyage rather than on annual terms4.
Critical Metrics to Watch
- Daily vessel traffic and war-risk vessel insurance premiums are early indicators of Strait of Hormuz viability.
- Recovering vessel counts and reductions in insurer coverage costs will signal improving energy flow.
- Even as transit improves, full supply chain normalization — freight patterns, inventory, and supplier confidence — will likely take months.
The Impact of Crude Oil on Nitrile Glove Costs
* Approximate cost structure based on generic 3.5g nitrile gloves
An Estimated 76% of glove costs are directly impacted by crude oil price.
Nitrile Glove Potential Stabilization Timeline
Day 1
Strait of Hormuz Restored
Strait of Hormuz vessel traffic normalizes.
Month 1-4
Feedstock Supply Stabilizes
Butadiene and acrylonitrile stabilizes and NBR costs reduce over time as damaged infrastructure repairs.
Month 5+
Restored Finished Goods Prices
Manufacturers incorporate lower cost NBR, reducing FG pricing toward pre-conflict norms.
Month 6-10
Lower-Cost Products Hits US Supply Chains
Lower-cost product enters the US Supply chain and cycles through 2-3 months of FIFO inventory.
Month 11+
End Users see reduced prices
Reduced-cost product begins reaching end user facilities.
Day 1
Strait of Hormuz Restored
Strait of Hormuz vessel traffic normalizes.
Month 1-4
Feedstock Supply Stabilizes
Butadiene and acrylonitrile stabilizes and NBR costs reduce over time as damaged infrastructure repairs.
Month 5+
Restored Finished Goods Prices
Manufacturers incorporate lower cost NBR, reducing FG pricing toward pre-conflict norms.
Month 6-10
Lower-Cost Products Hits US Supply Chains
Lower-cost product enters the US Supply chain and cycles through 2-3 months of FIFO inventory.
Month 11+
End Users see reduced prices
Reduced-cost product begins reaching end user facilities.
Day 1
Strait of Hormuz Restored
Strait of Hormuz vessel traffic normalizes.
Month 1-4
Feedstock Supply Stabilizes
Butadiene and acrylonitrile stabilizes and NBR costs reduce over time as damaged infrastructure repairs.
Month 5+
Restored Finished Goods Prices
Manufacturers incorporate lower cost NBR, reducing FG pricing toward pre-conflict norms.
Month 6-10
Lower-Cost Products Hits US Supply Chains
Lower-cost product enters the US Supply chain and cycles through 2-3 months of FIFO inventory.
Month 11+
End Users see reduced prices
Reduced-cost product begins reaching end user facilities.
* Return to normal likely to be more nuanced as logistics easing in the Strait of Hormuz and infrastructure repairs will be gradual.
Supply Chain Impact





Downstream Product Impact
Constraint
Increase

- Limited flow of crude oil impacting NBR availability
- Manufacturers are sourcing NBR at highly elevated prices
- FG output slowed in April and May planning. Expected to continue in June.
- Cost of nitrile gloves have risen April and May production planning. Expected to continue in June.
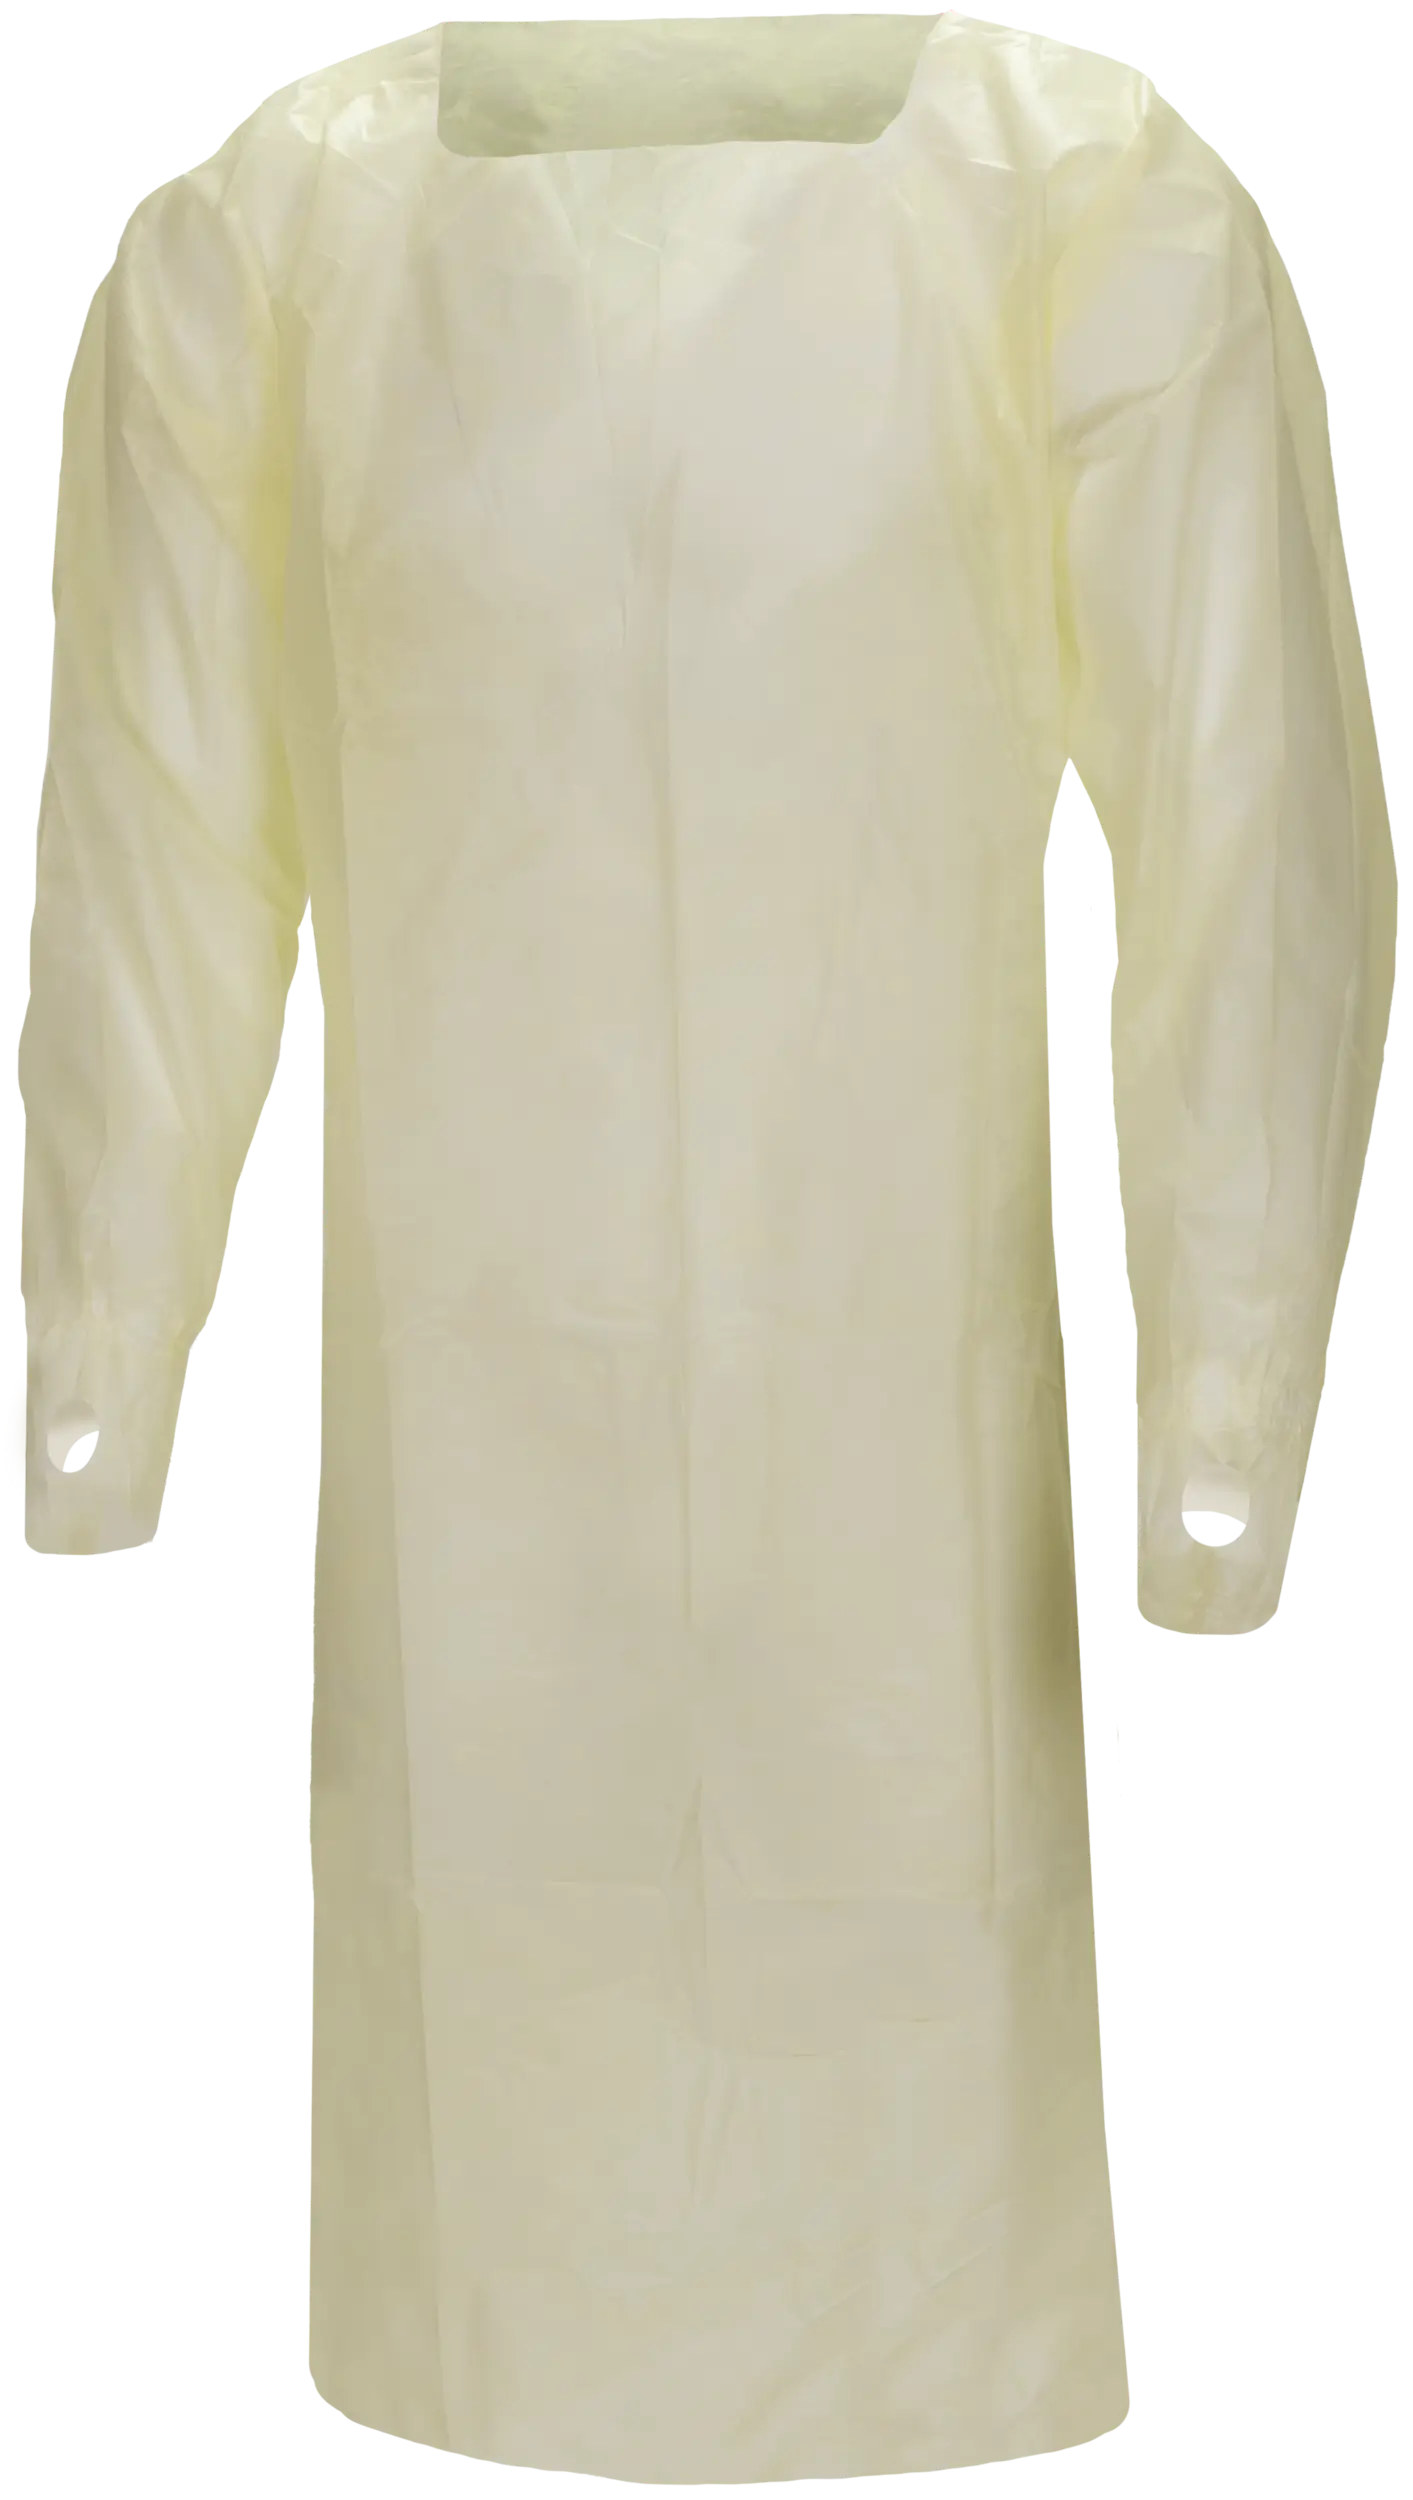
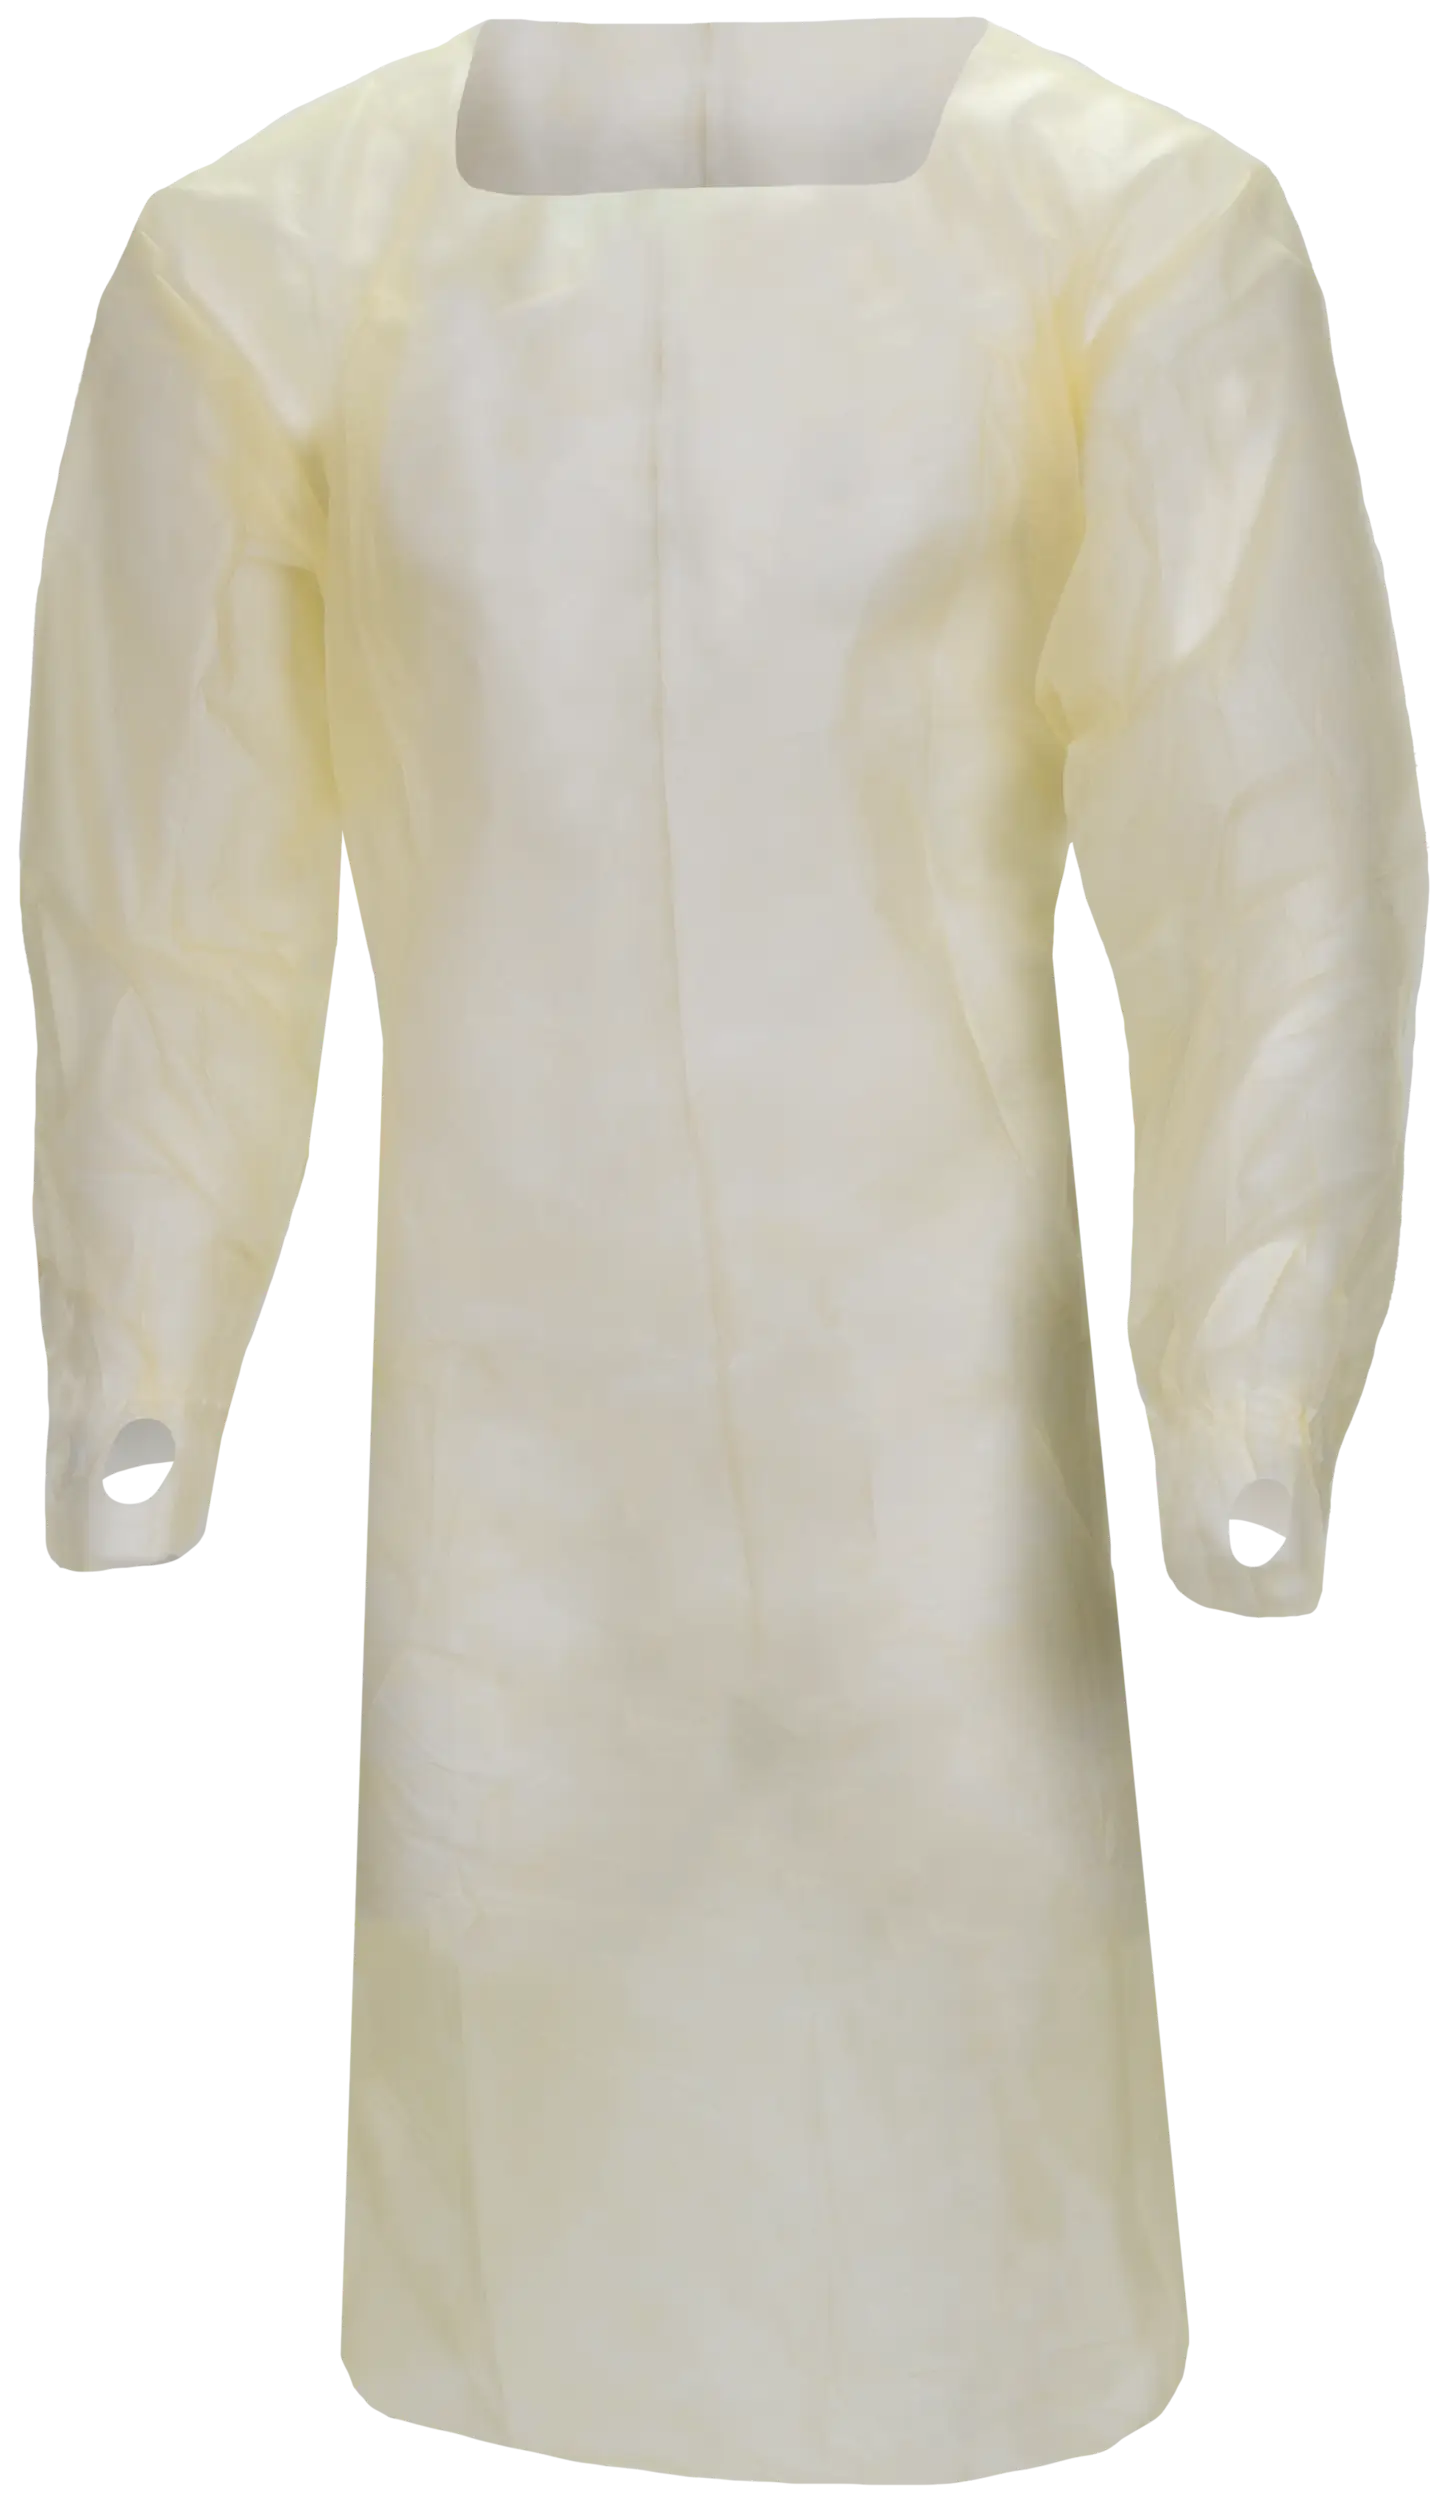
.png)
- Supply of raw materials remains stable
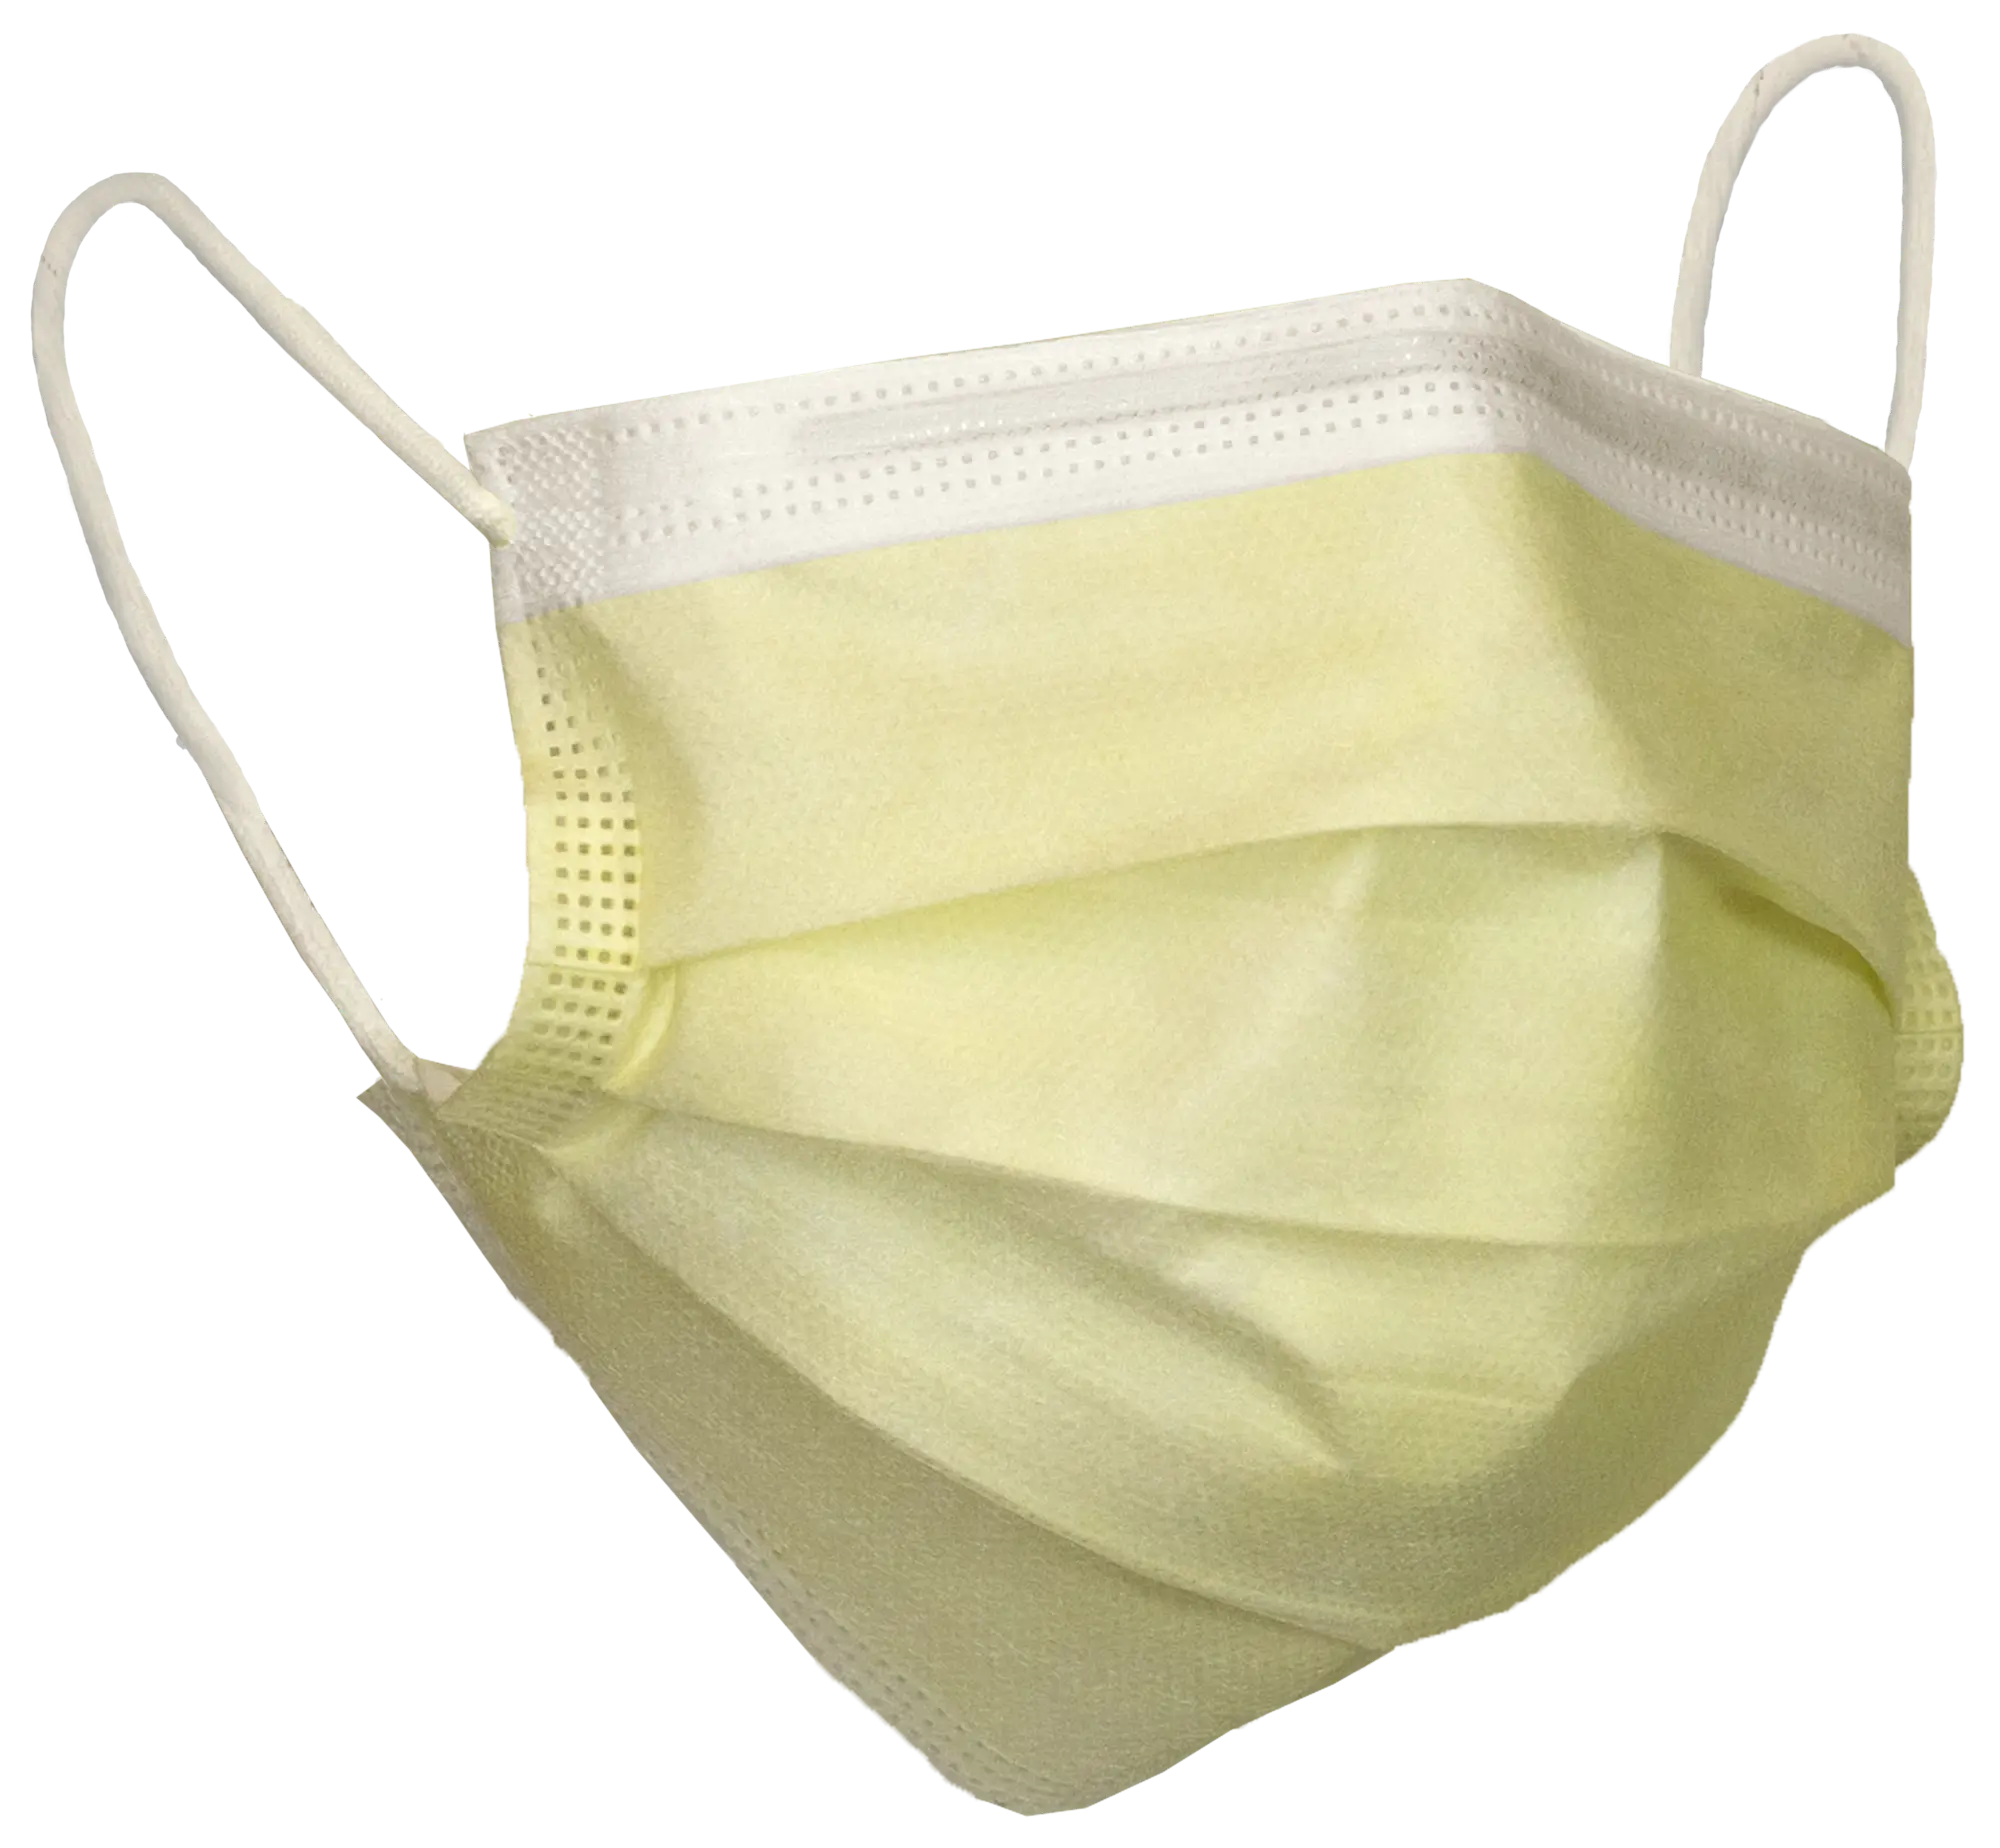
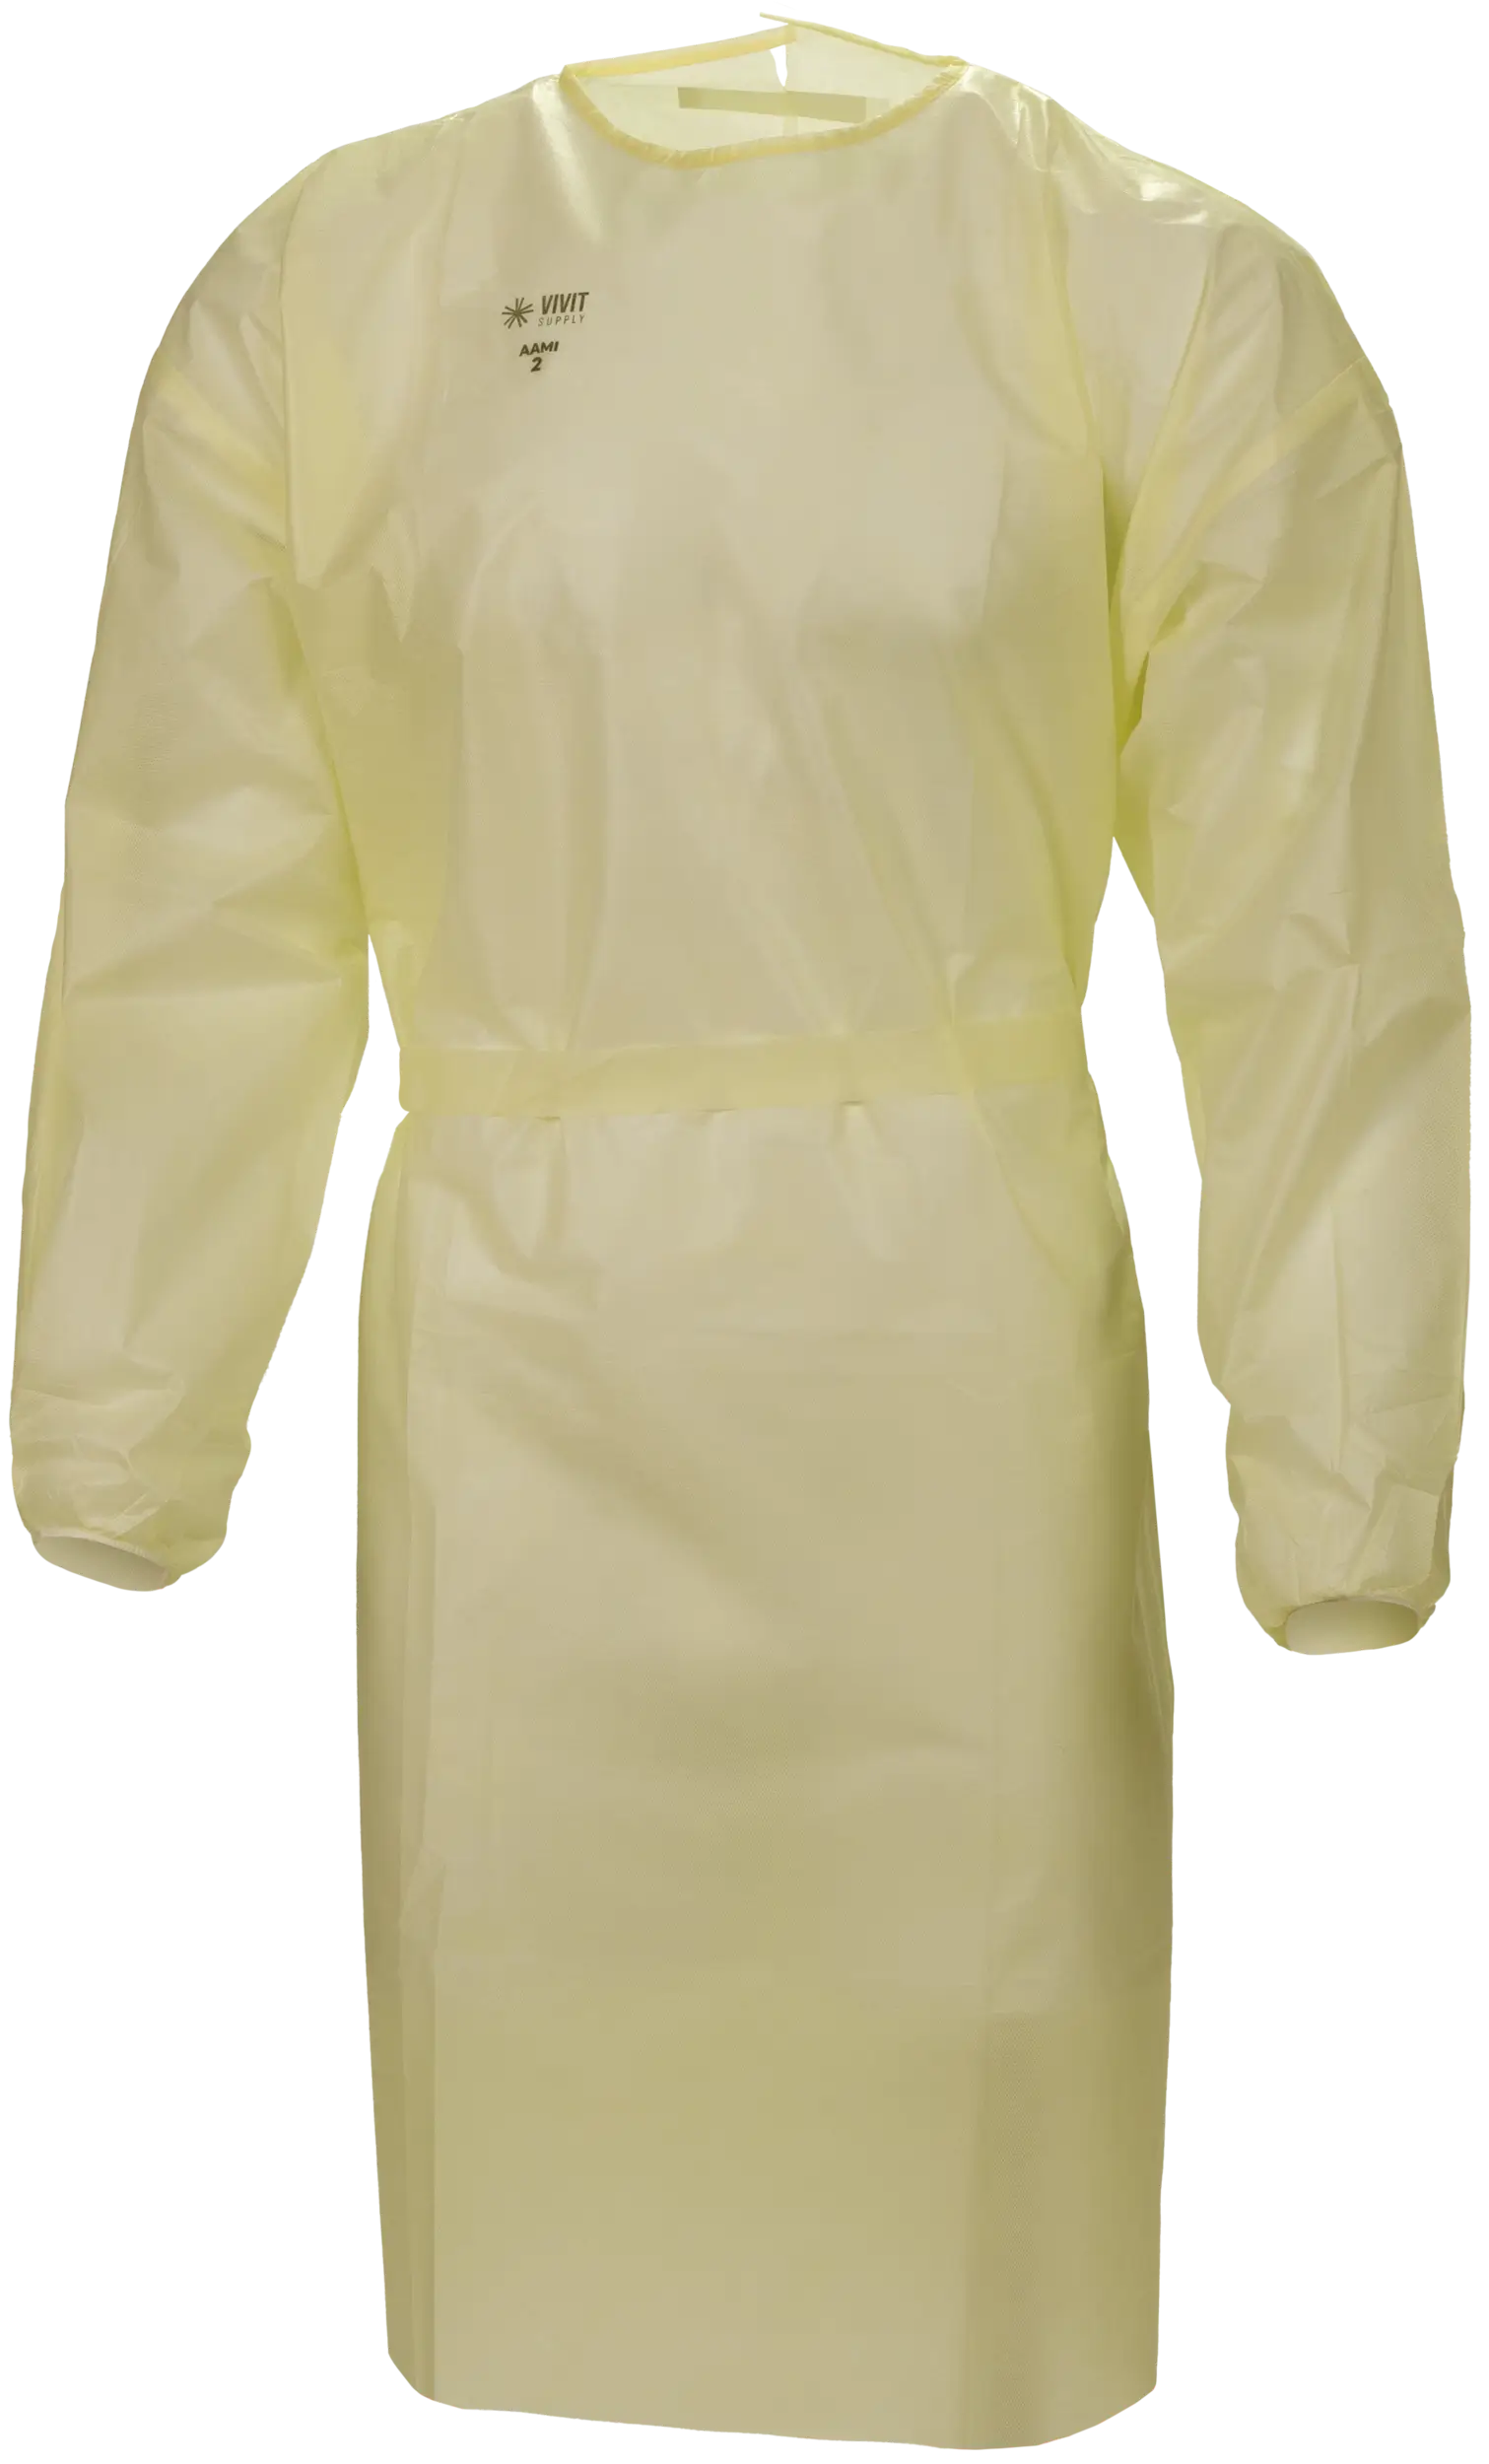
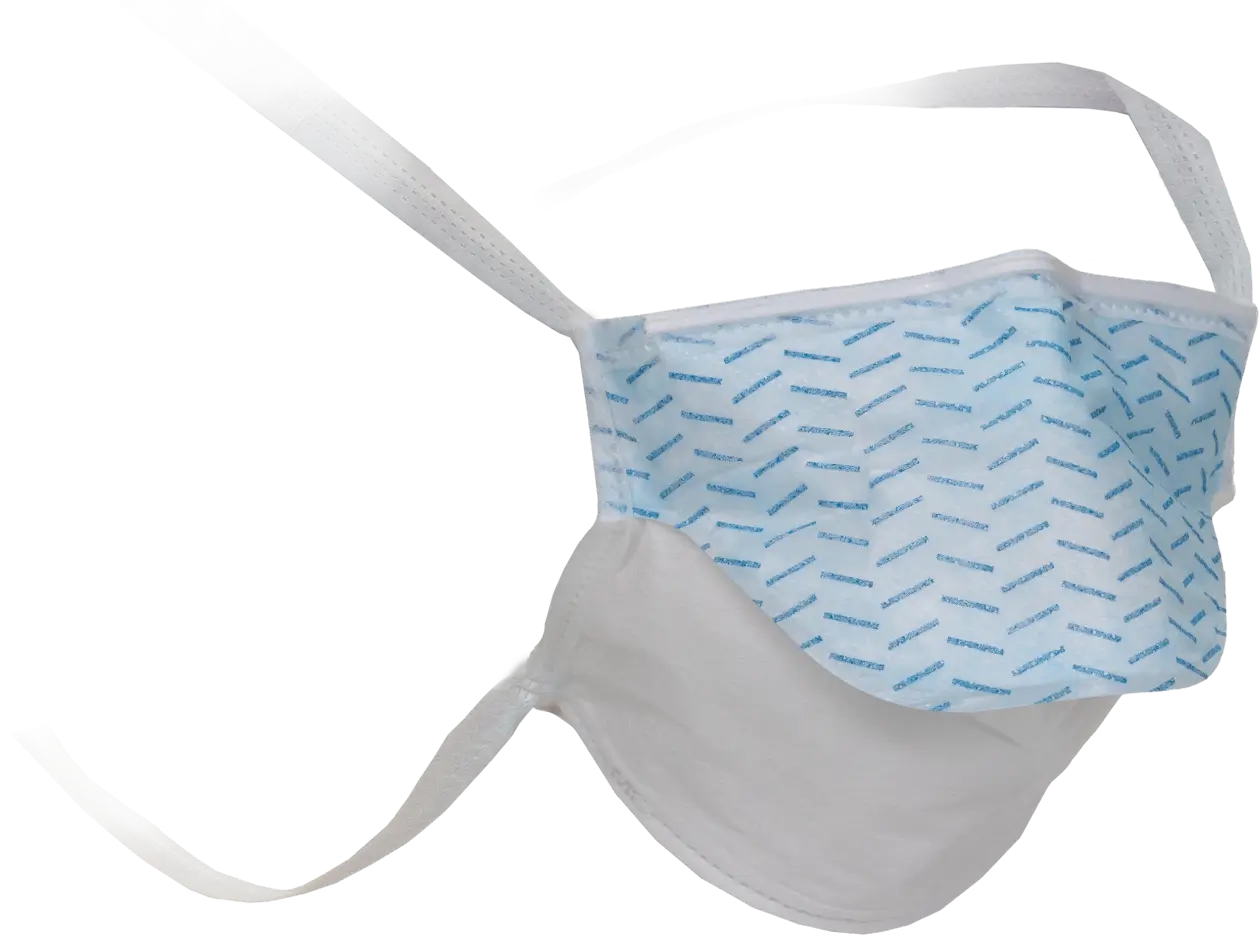
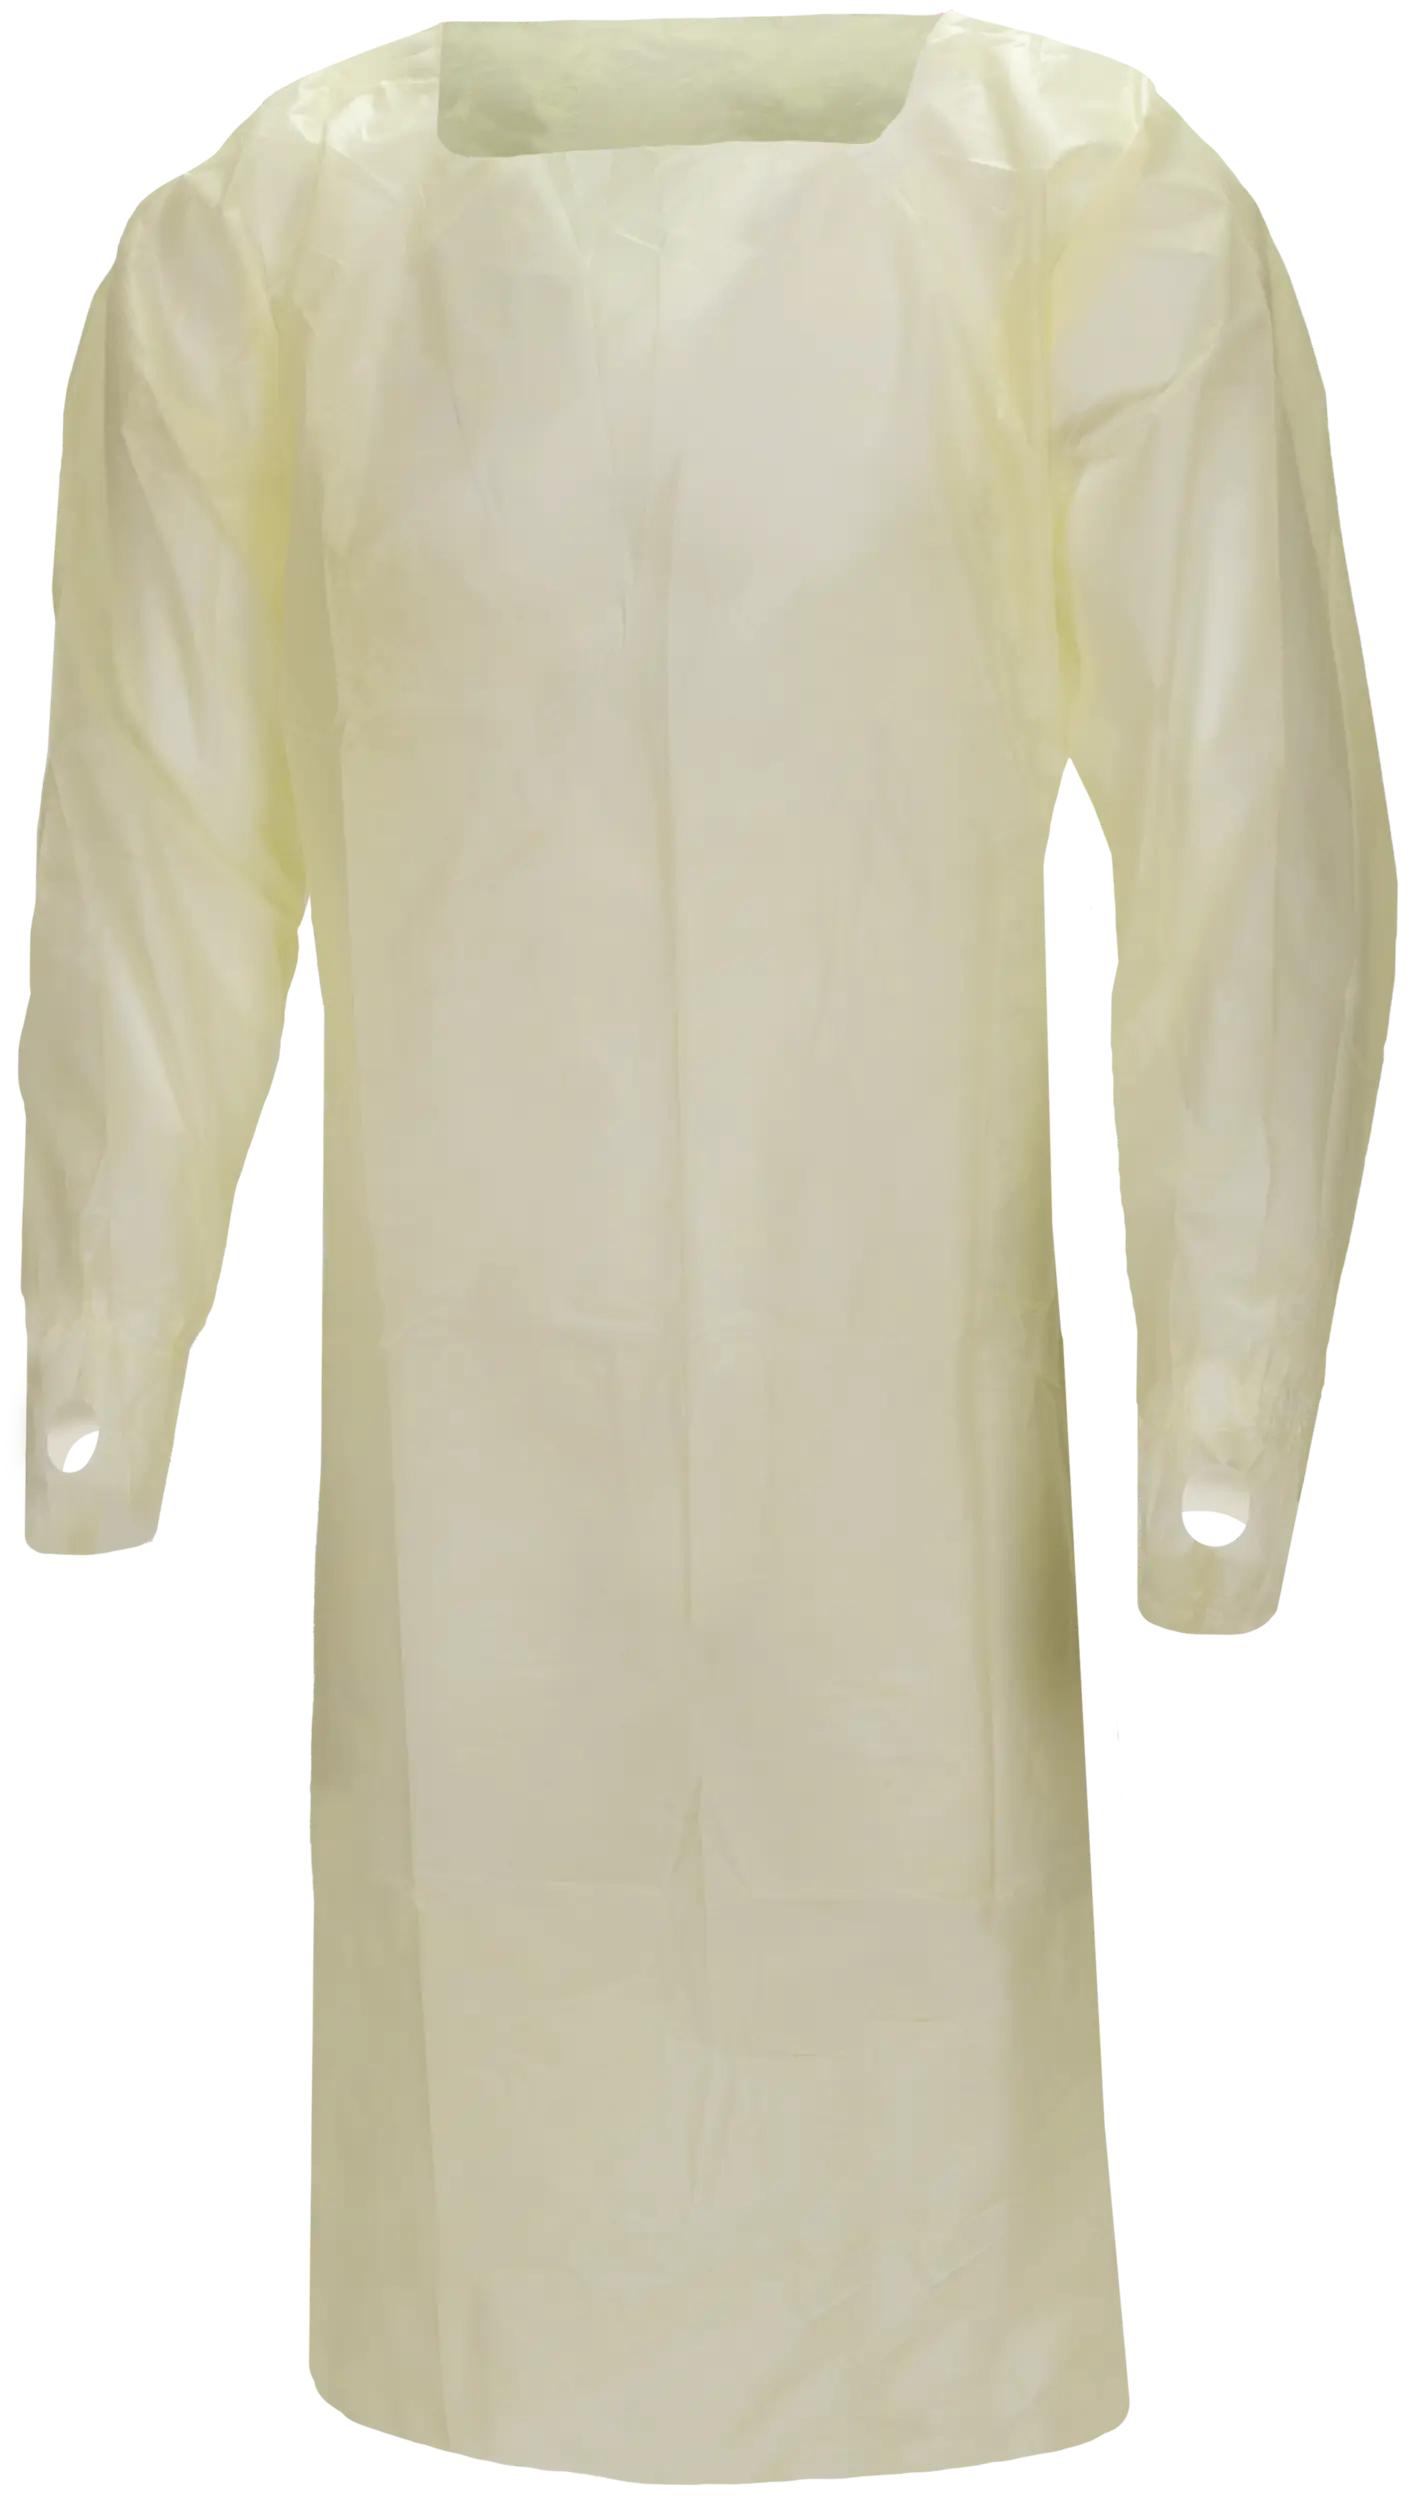
- Resin prices increasing, translating to an increase in RM price
- Manufacturer production remains stable
- Potential for future market price adjustment due to RM cost
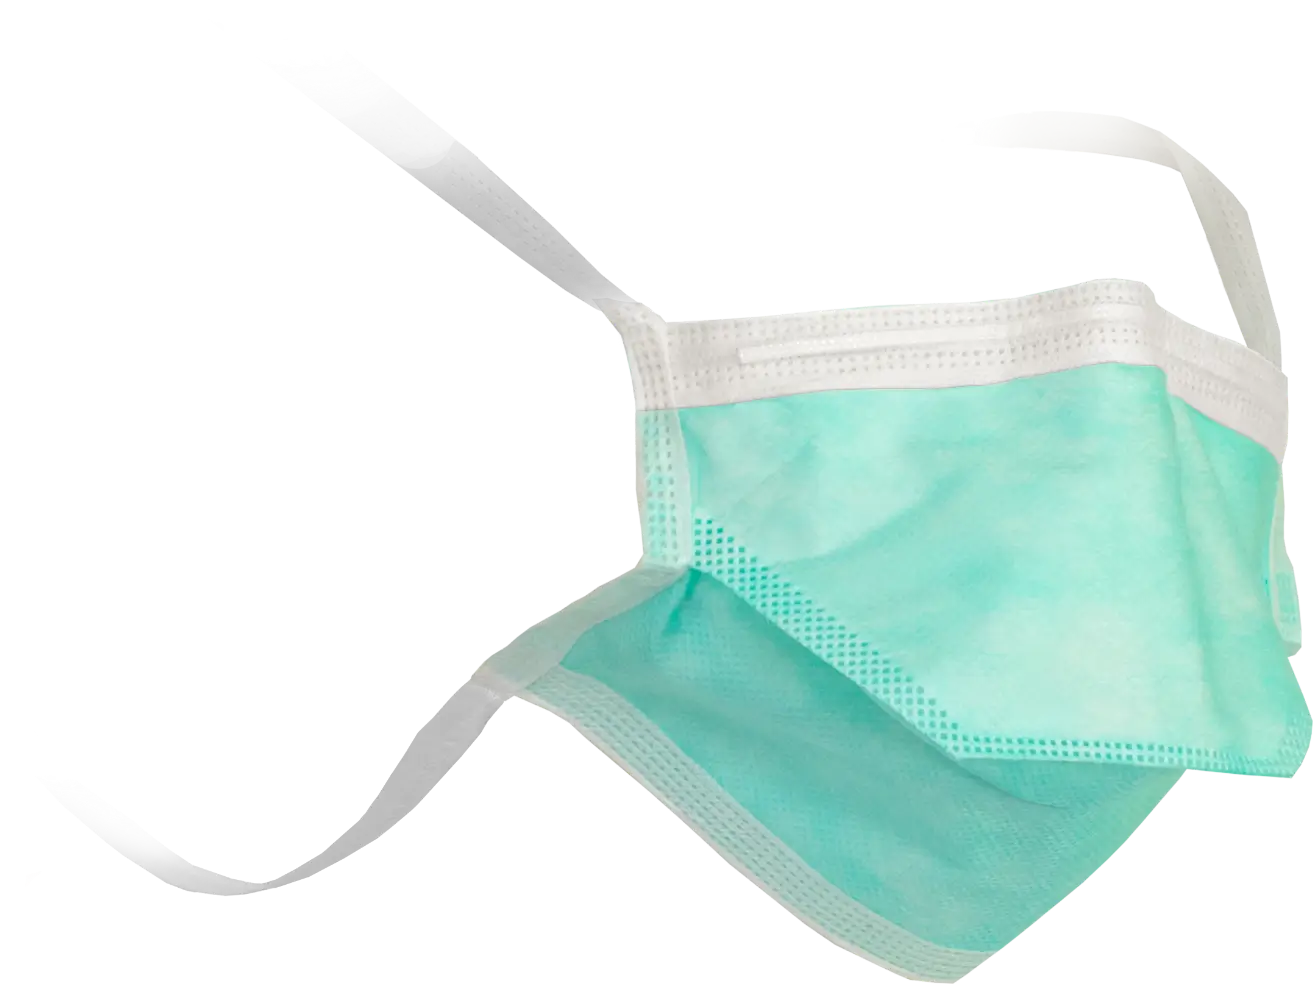
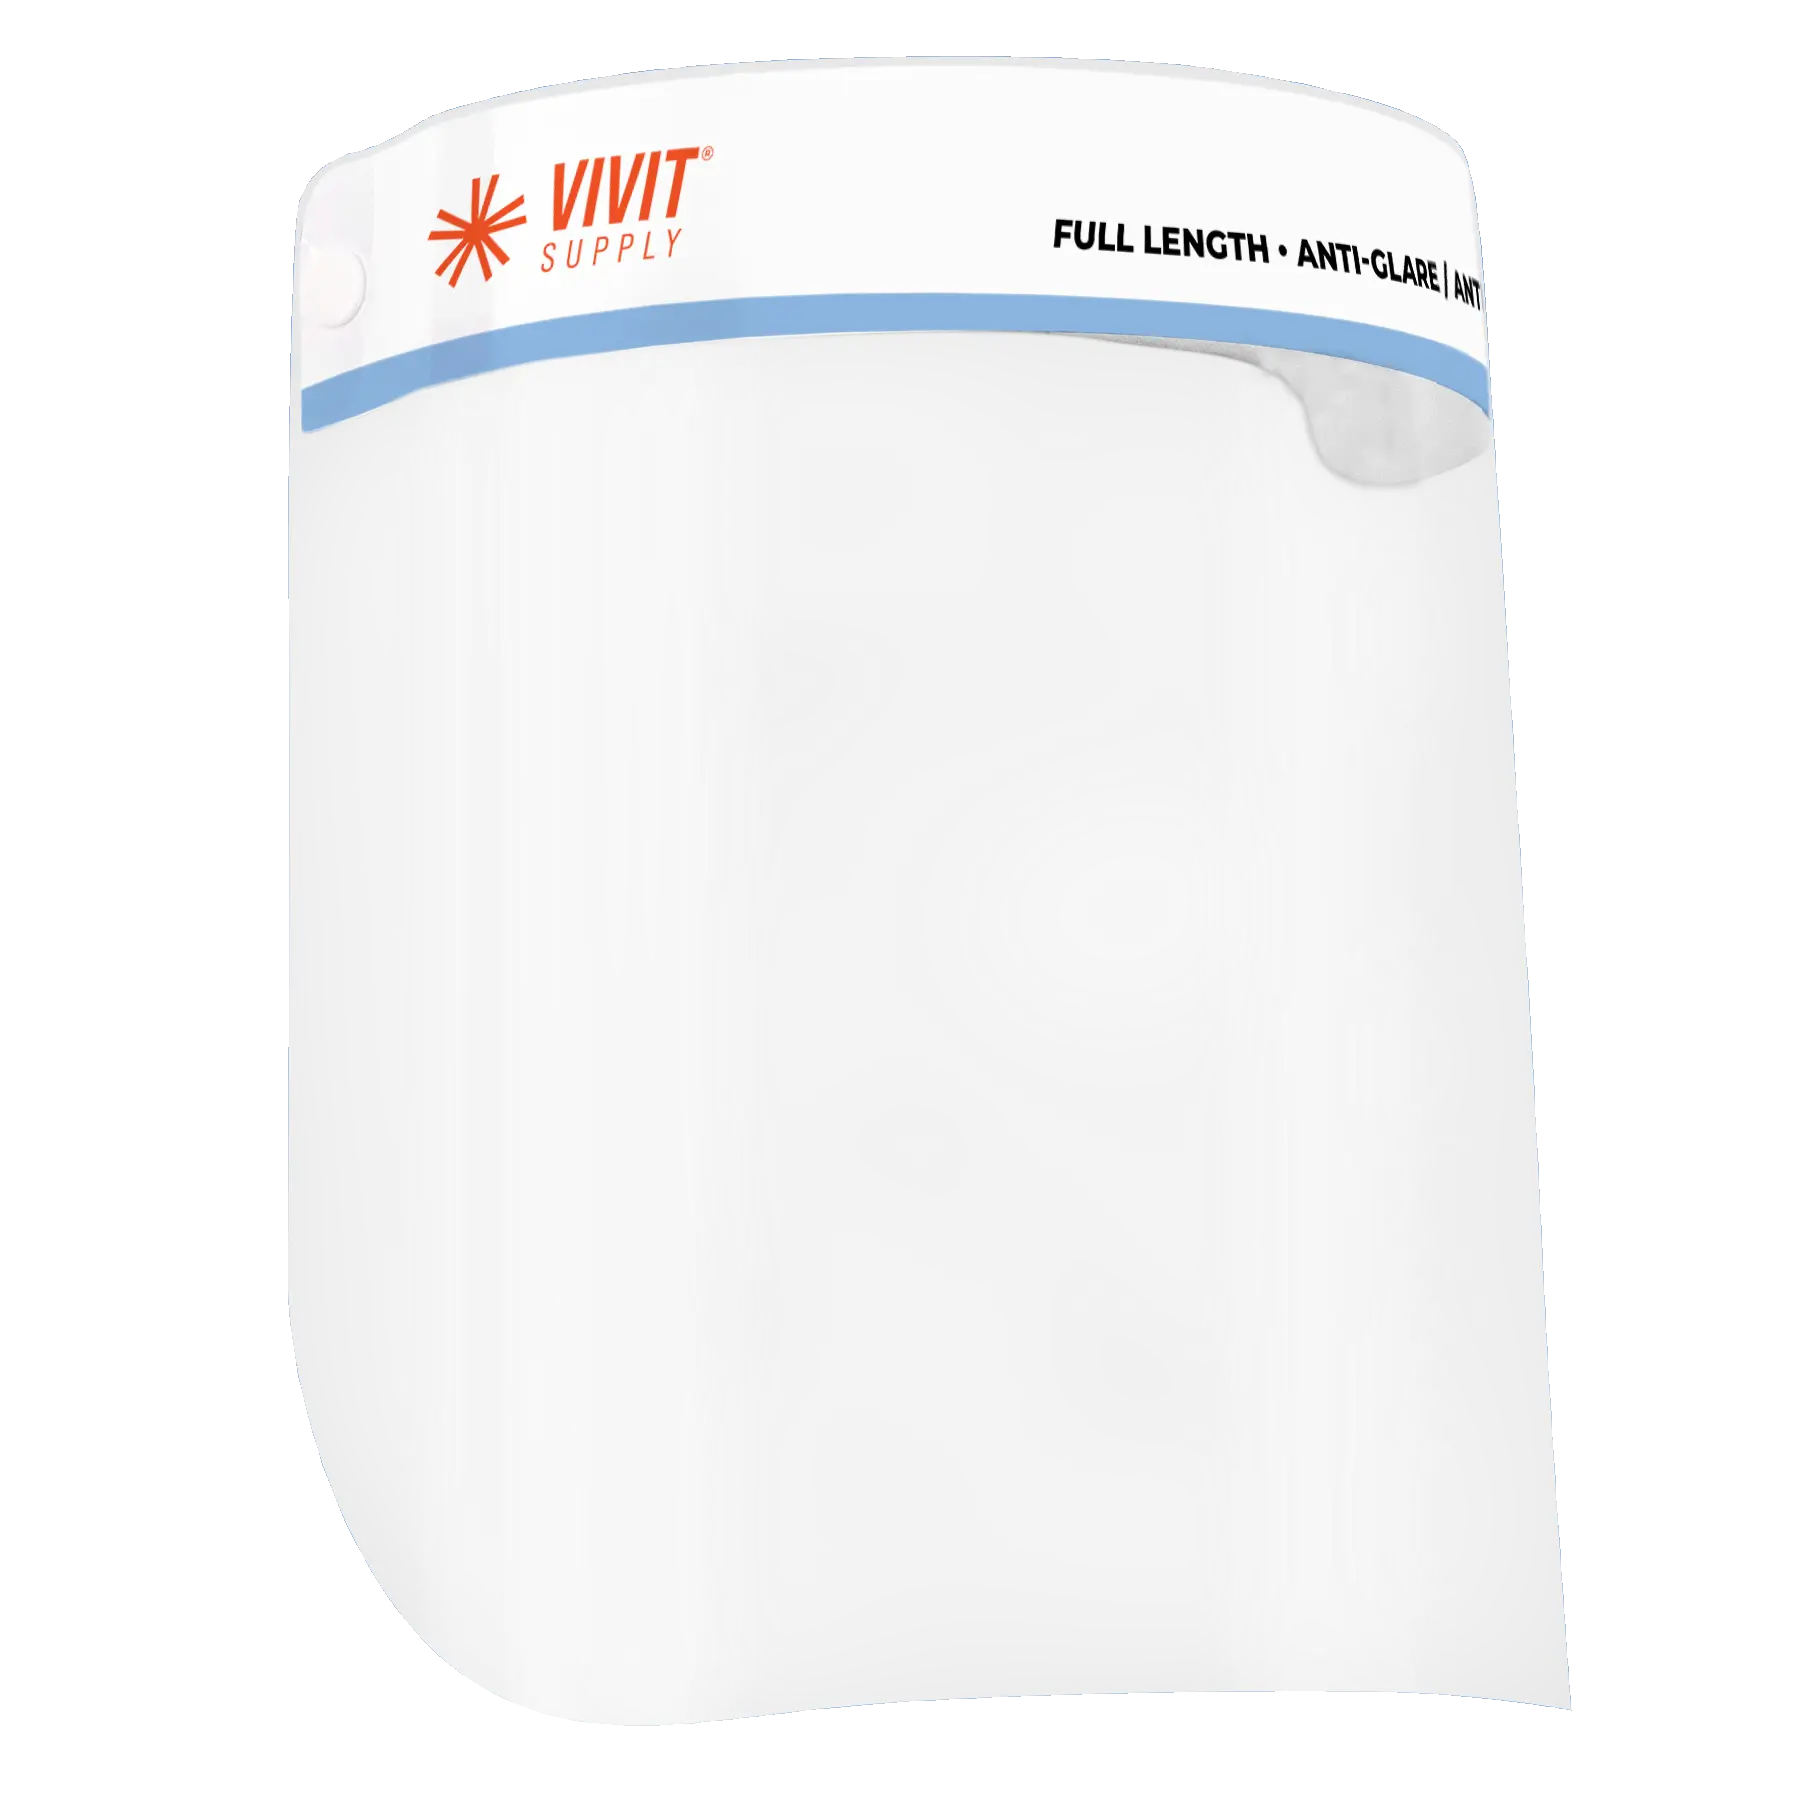
.png)
- Supply of raw materials remains stable
- Resin prices increasing, translating to an increase in RM price
- Manufacturer production remains stable
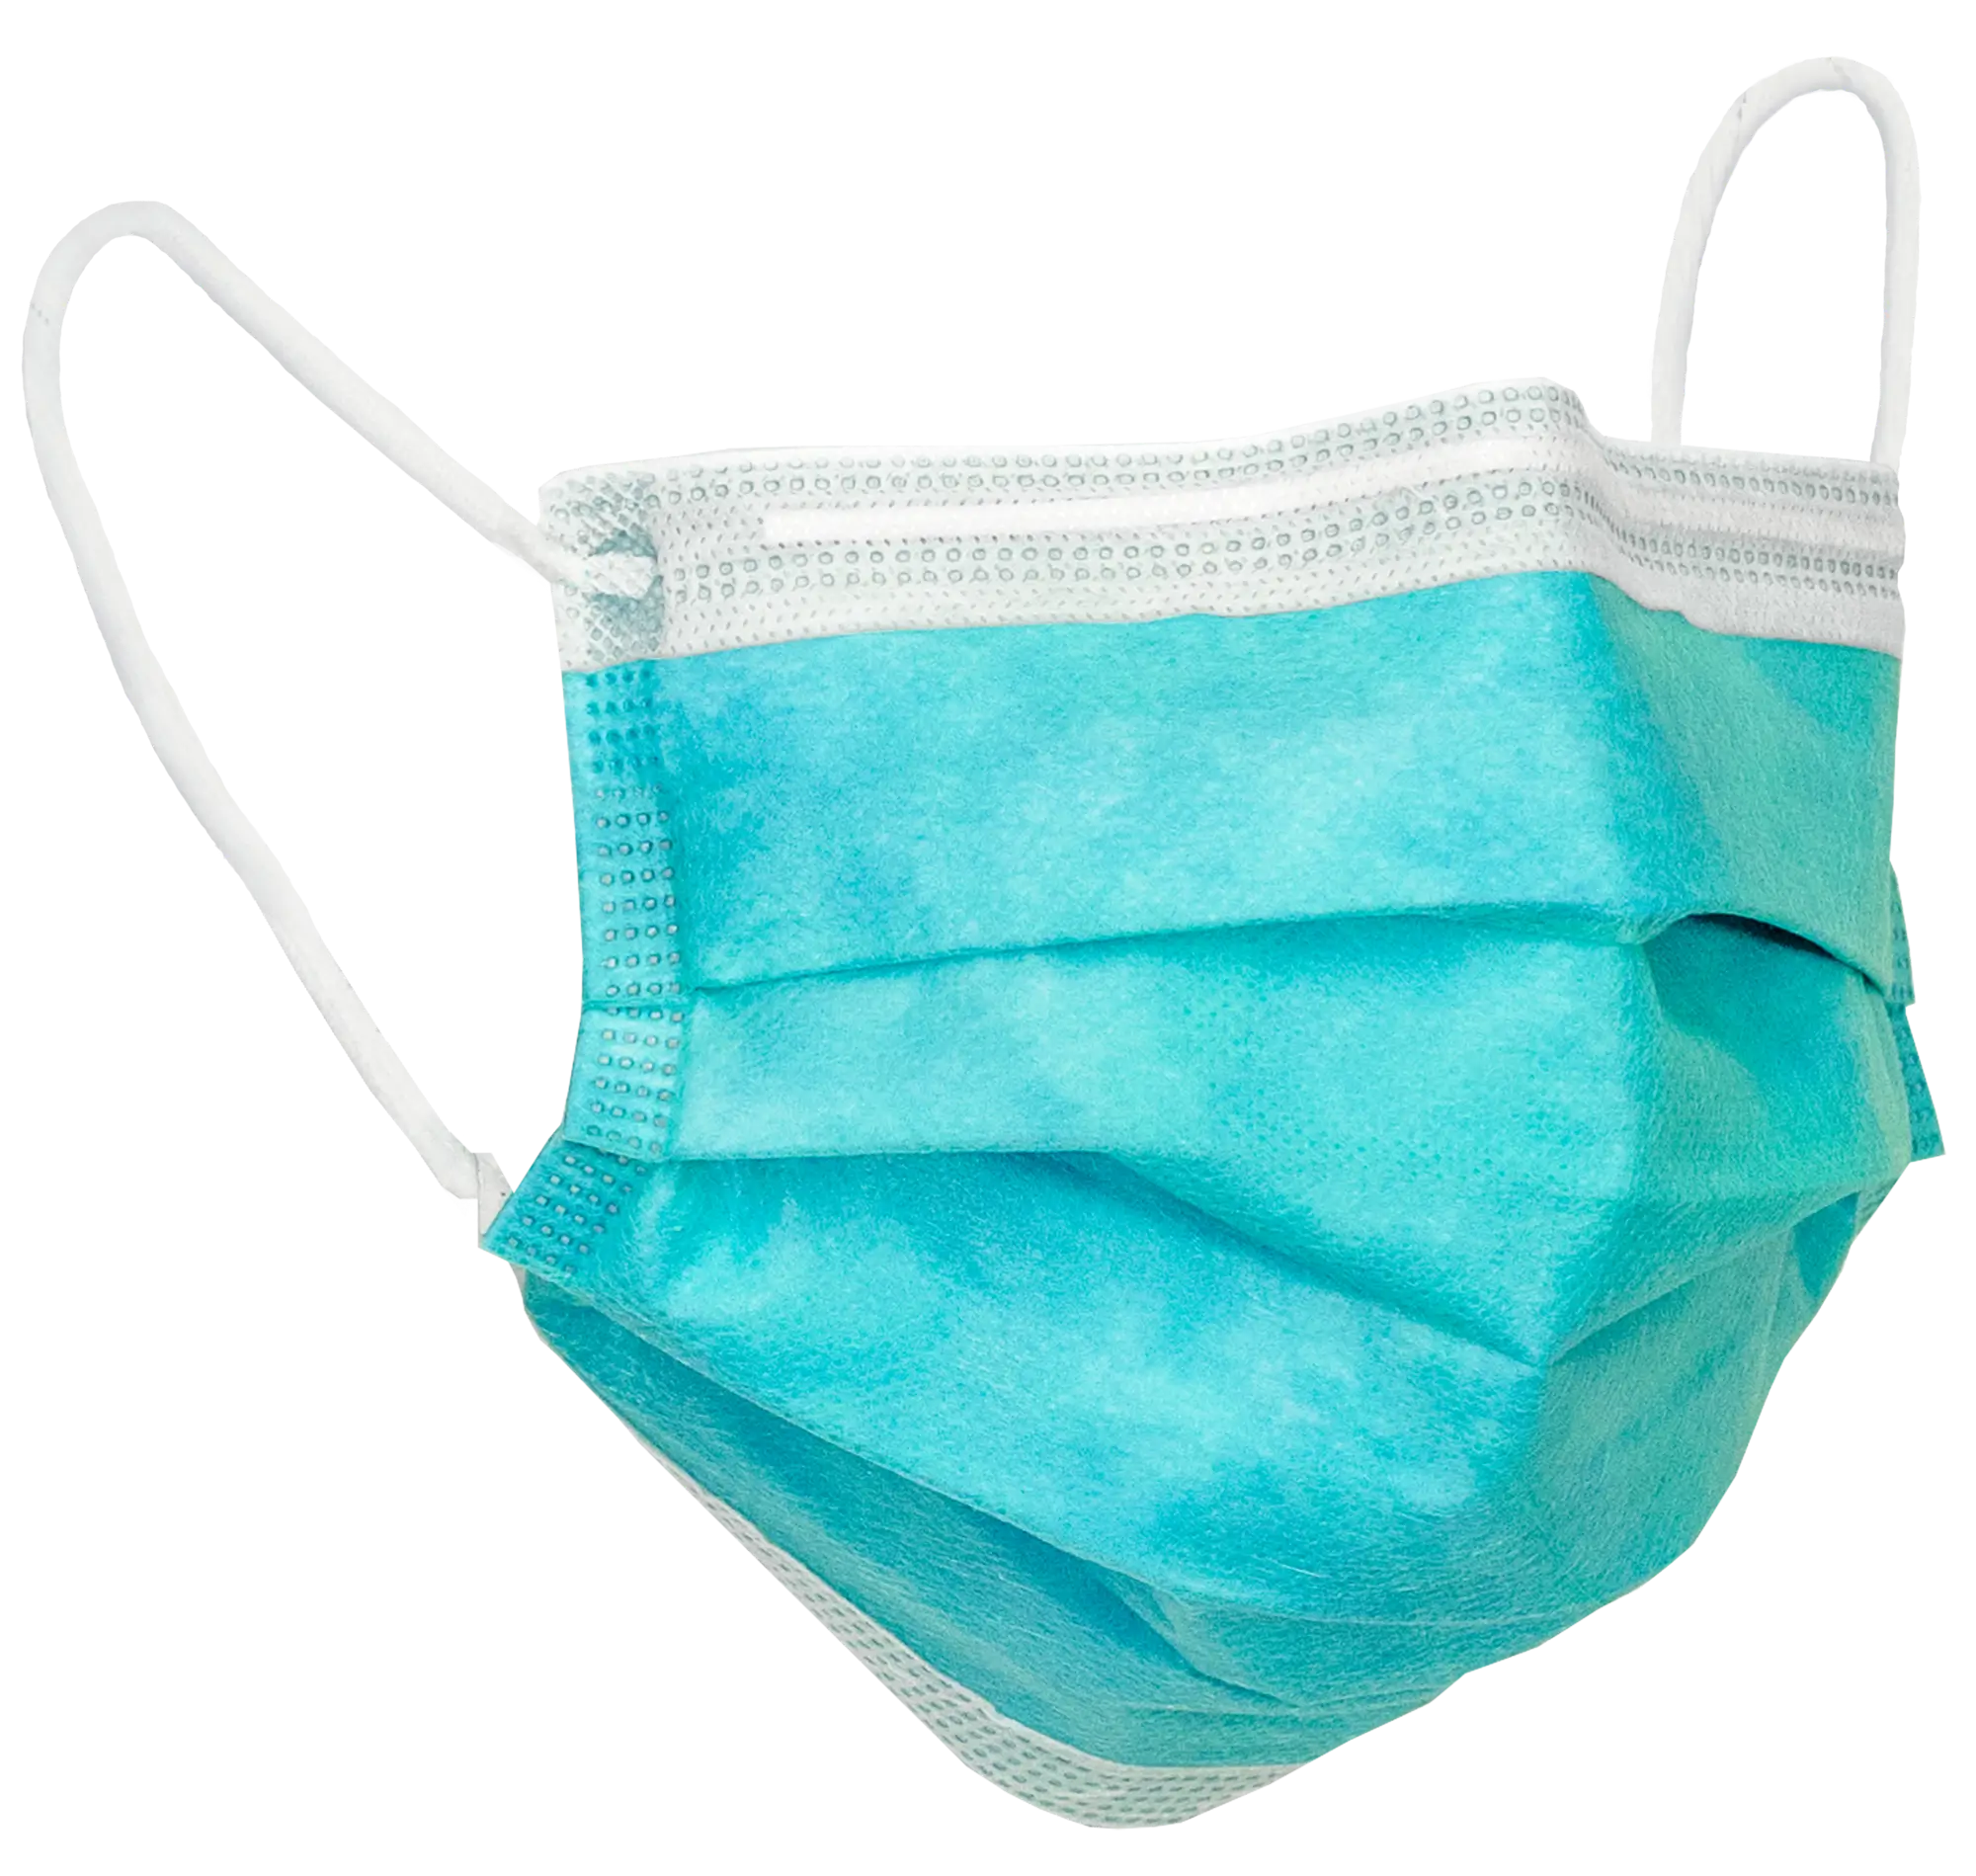
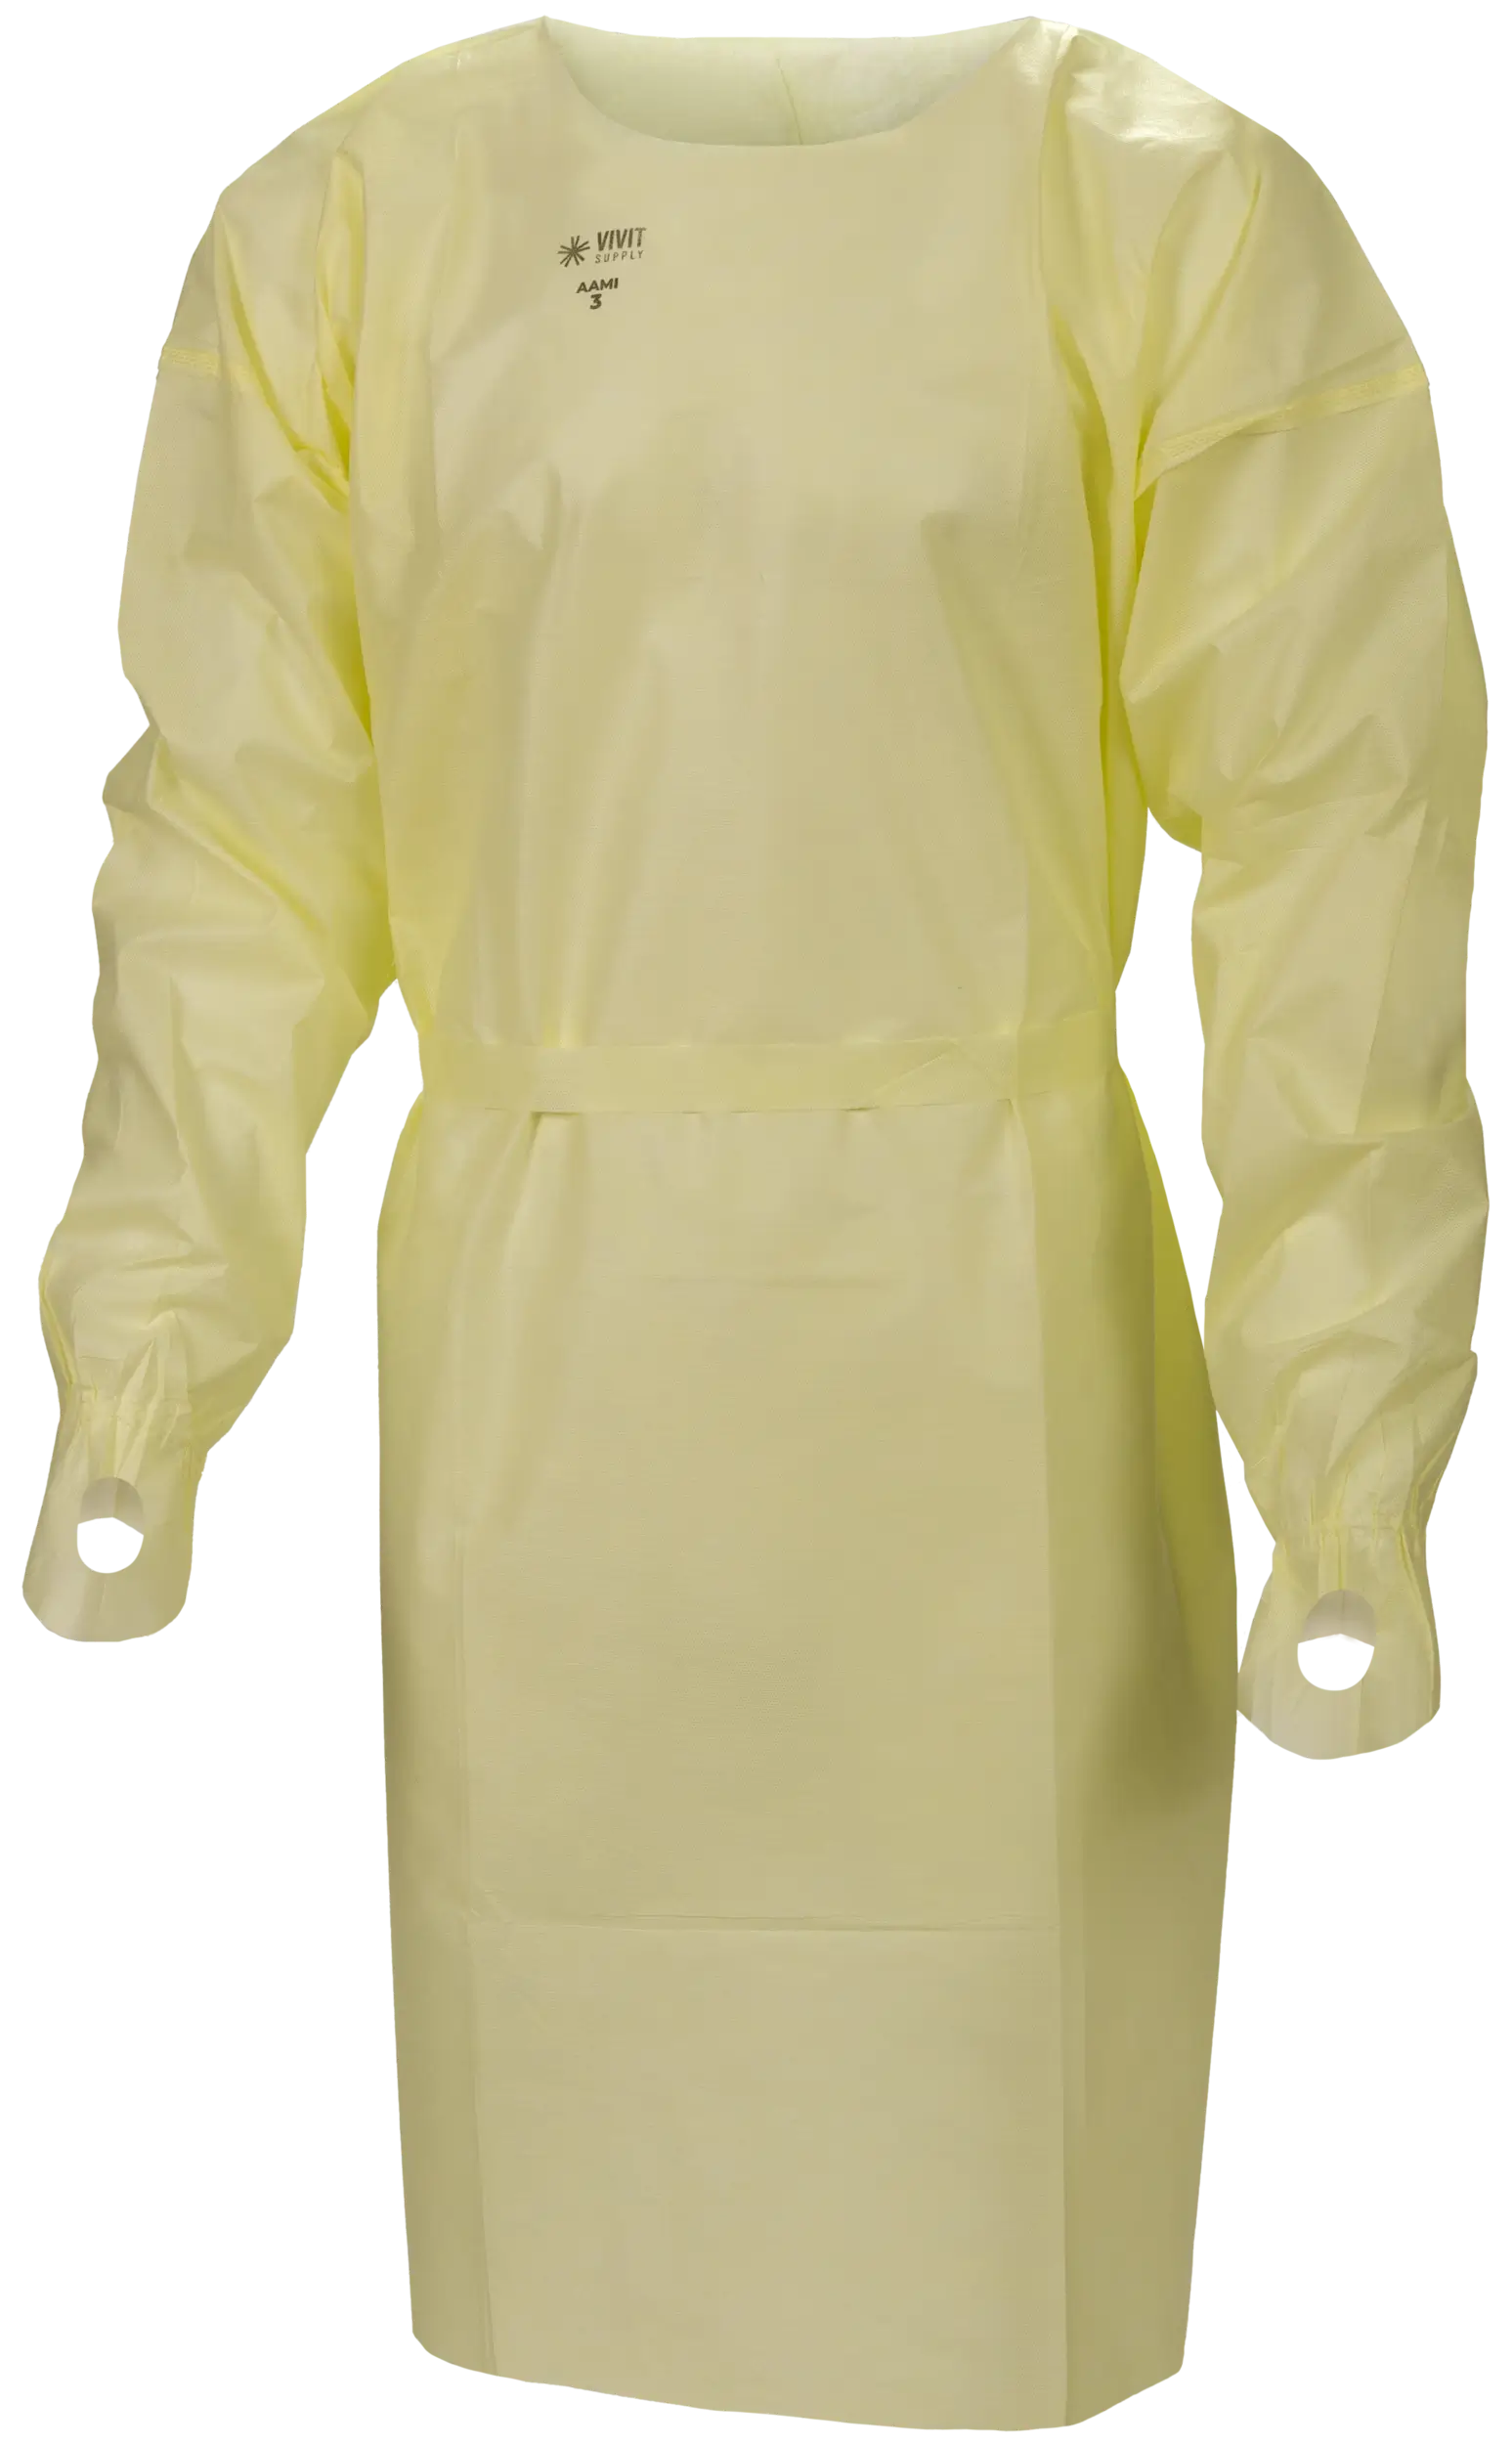
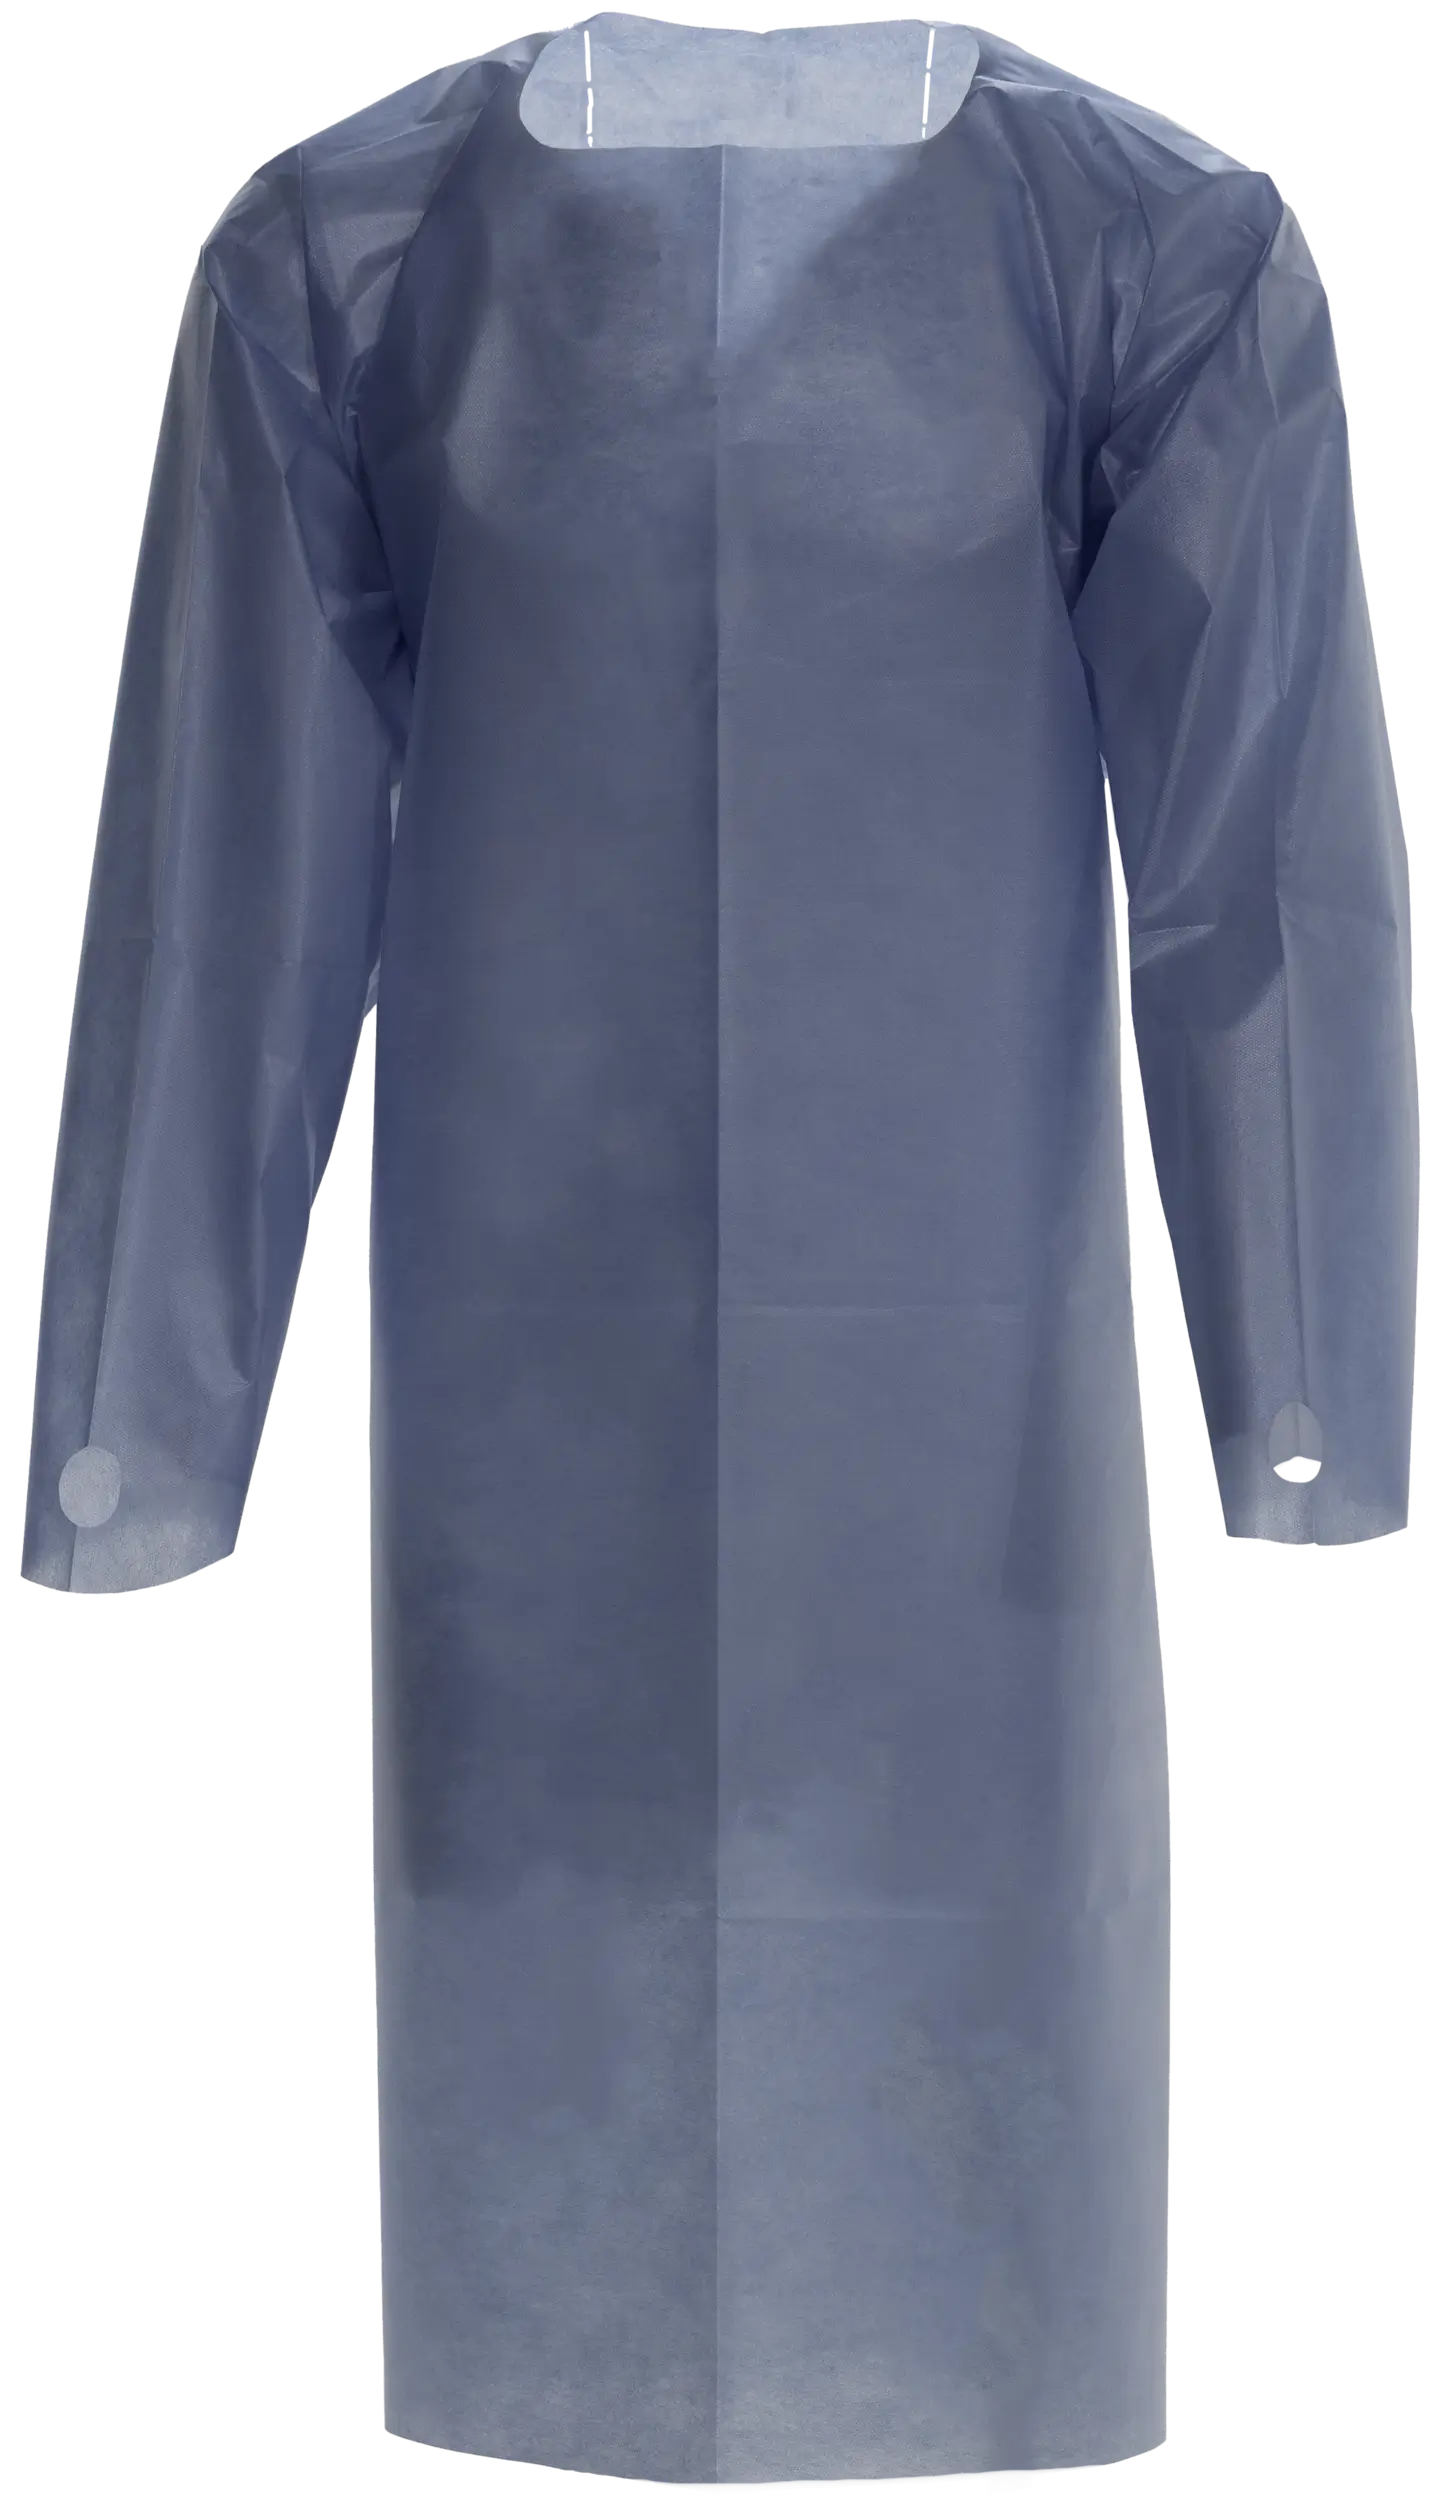
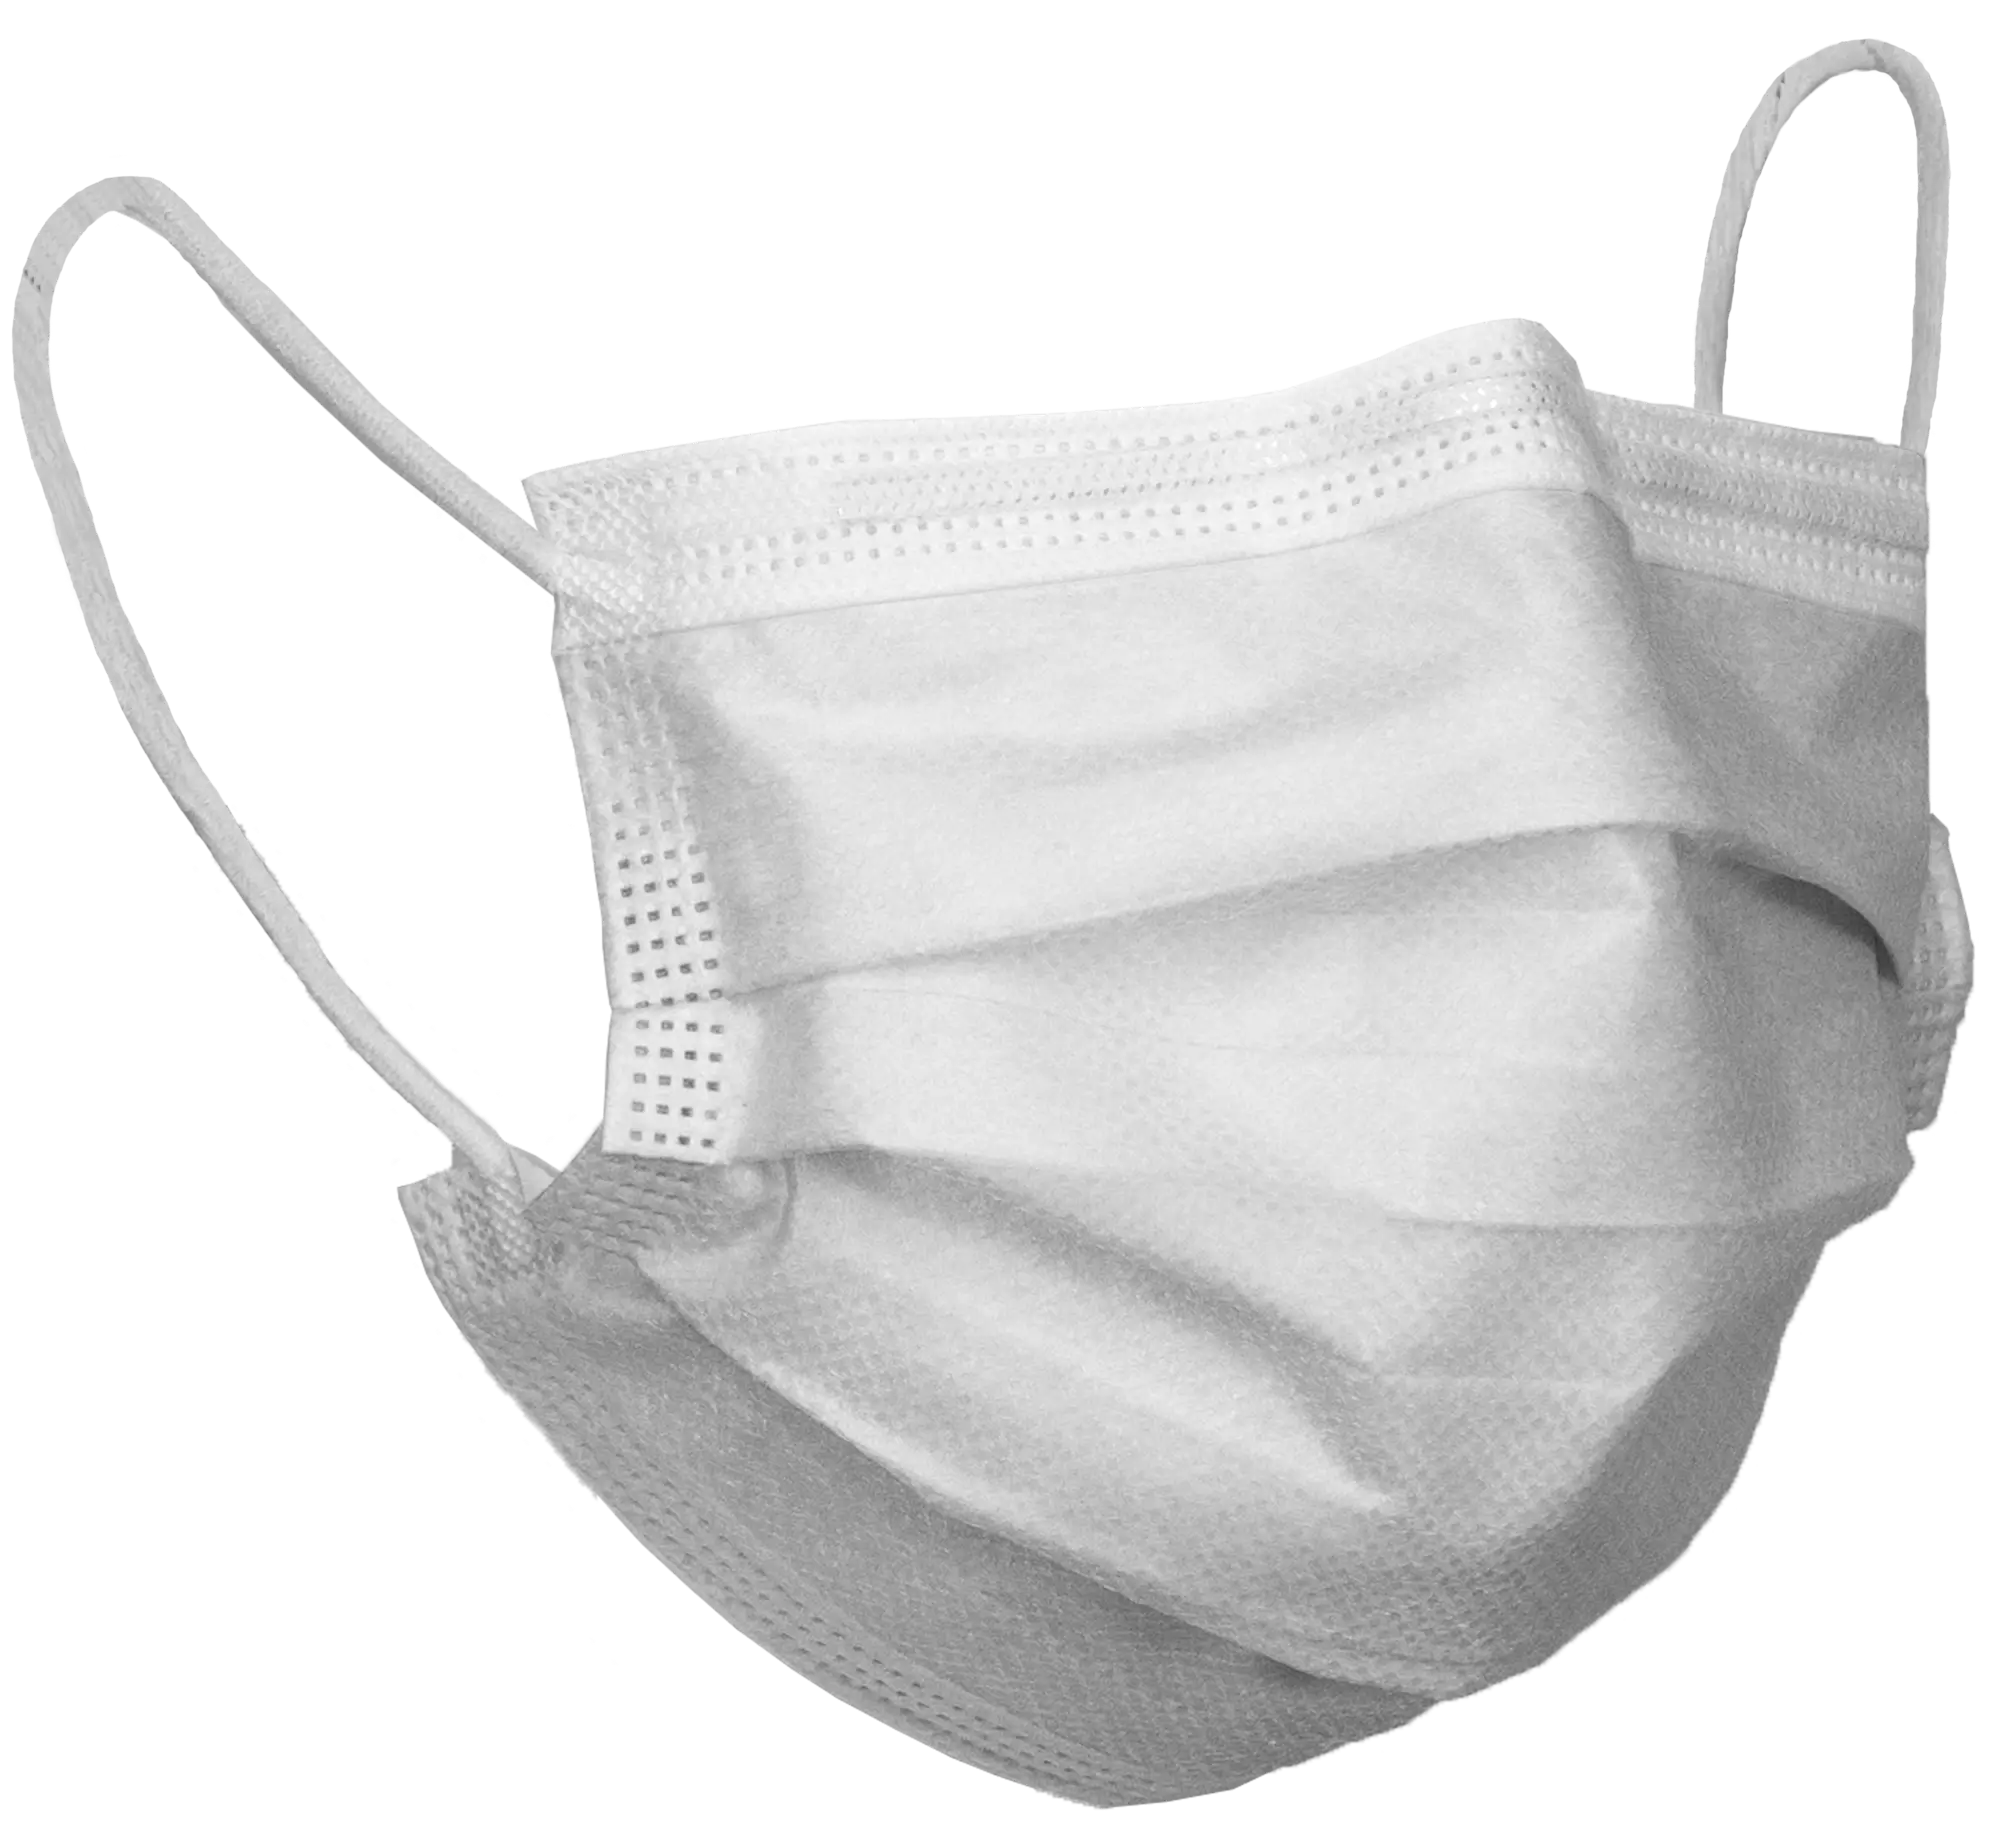
- Potential for future market price adjustment due to impact on production cost (vary by product)

