































Key Metrics
Current State of the U.S. Flu Season
Flu activity is still very low nationally, but hospital admissions are climbing fast. ER visits and wastewater are low across the U.S. as a whole, but some states are seeing sharp increases. View the map
We track three key signals each week to provide a more compete picture of how the flu season is unfolding, it's impact on hospitals, and how activity is trending.
Acute Respiratory Illness (ARI)(% of ER visits)
ER visits for any respiratory illness, from colds to flu, COVID-19 and RSV, with or without fever. CDC says it provides a fuller picture than the older ILI measure.
Influenza Admissions(Hospital admissions per 100k people)
Number of patients with laboratory-confirmed influenza who were admitted to the hospital each week, per 100,000 people, the rate CDC uses to set its levels.
Influenza A Wastewater(WVAL)
Influenza A virus levels in sewage. CDC developed the wastewater viral activity level (WVAL) to compare wastewater data within and across sites.
Current Strains, Vaccine Coverage & Match
Is this season’s vaccine a good match?
So far, yes. The vaccine covers the three main circulating strains, and lab tests show a strong match. One to watch: H1N1 is evolving, and it’s too early to know if that will weaken the match.
How well the vaccine matches circulating strains is an early clue to how severe the season could get.
| Strain | Share of identified flu | Covered by the vaccine? | How well it matches |
|---|---|---|---|
| A(H1N1)Most common in the U.S. | 95.6%of identified samples | YesA/Missouri/11/2025 | Strong match93% of 88 tested |
| A(H3N2)Subclade K | 2.0%of identified samples | YesUpdated for subclade K | Strong match100% of 22 tested |
| B (Victoria)Influenza B | 2.2%of identified samples | YesB/Pennsylvania/14/2025 | Strong match100% of 30 tested |
A(H1N1)Most common in the U.S.
- Share of identified flu
- 95.6%
- Covered by the vaccine?
- YesA/Missouri/11/2025
- How well it matches
- Strong match93% of 88 tested
A(H3N2)Subclade K
- Share of identified flu
- 2.0%
- Covered by the vaccine?
- YesUpdated for subclade K
- How well it matches
- Strong match100% of 22 tested
B (Victoria)Influenza B
- Share of identified flu
- 2.2%
- Covered by the vaccine?
- YesB/Pennsylvania/14/2025
- How well it matches
- Strong match100% of 30 tested
A good match only helps if people get vaccinated
Fewer than half of Americans got a flu shot last season. Down from 52% in 2020–21.
This season: 2026–27 estimates aren’t available yet. Manufacturers project up to 135 million doses, down from 154 million last season.
Affected Areas
Where is flu spreading?
Flu cases are concentrated in the South and West, led by Hawaii and Louisiana. Most states are still at minimal levels.
Wastewater suggests California, Texas and Florida are likely to see flu cases rise more than the average in the coming weeks.
Activity Level
- Very high0 states
- High0 states
- Moderate2 states
- Low5 states
- Minimal44 states
Medical PPE Planning
How does the flu season affect PPE usage?
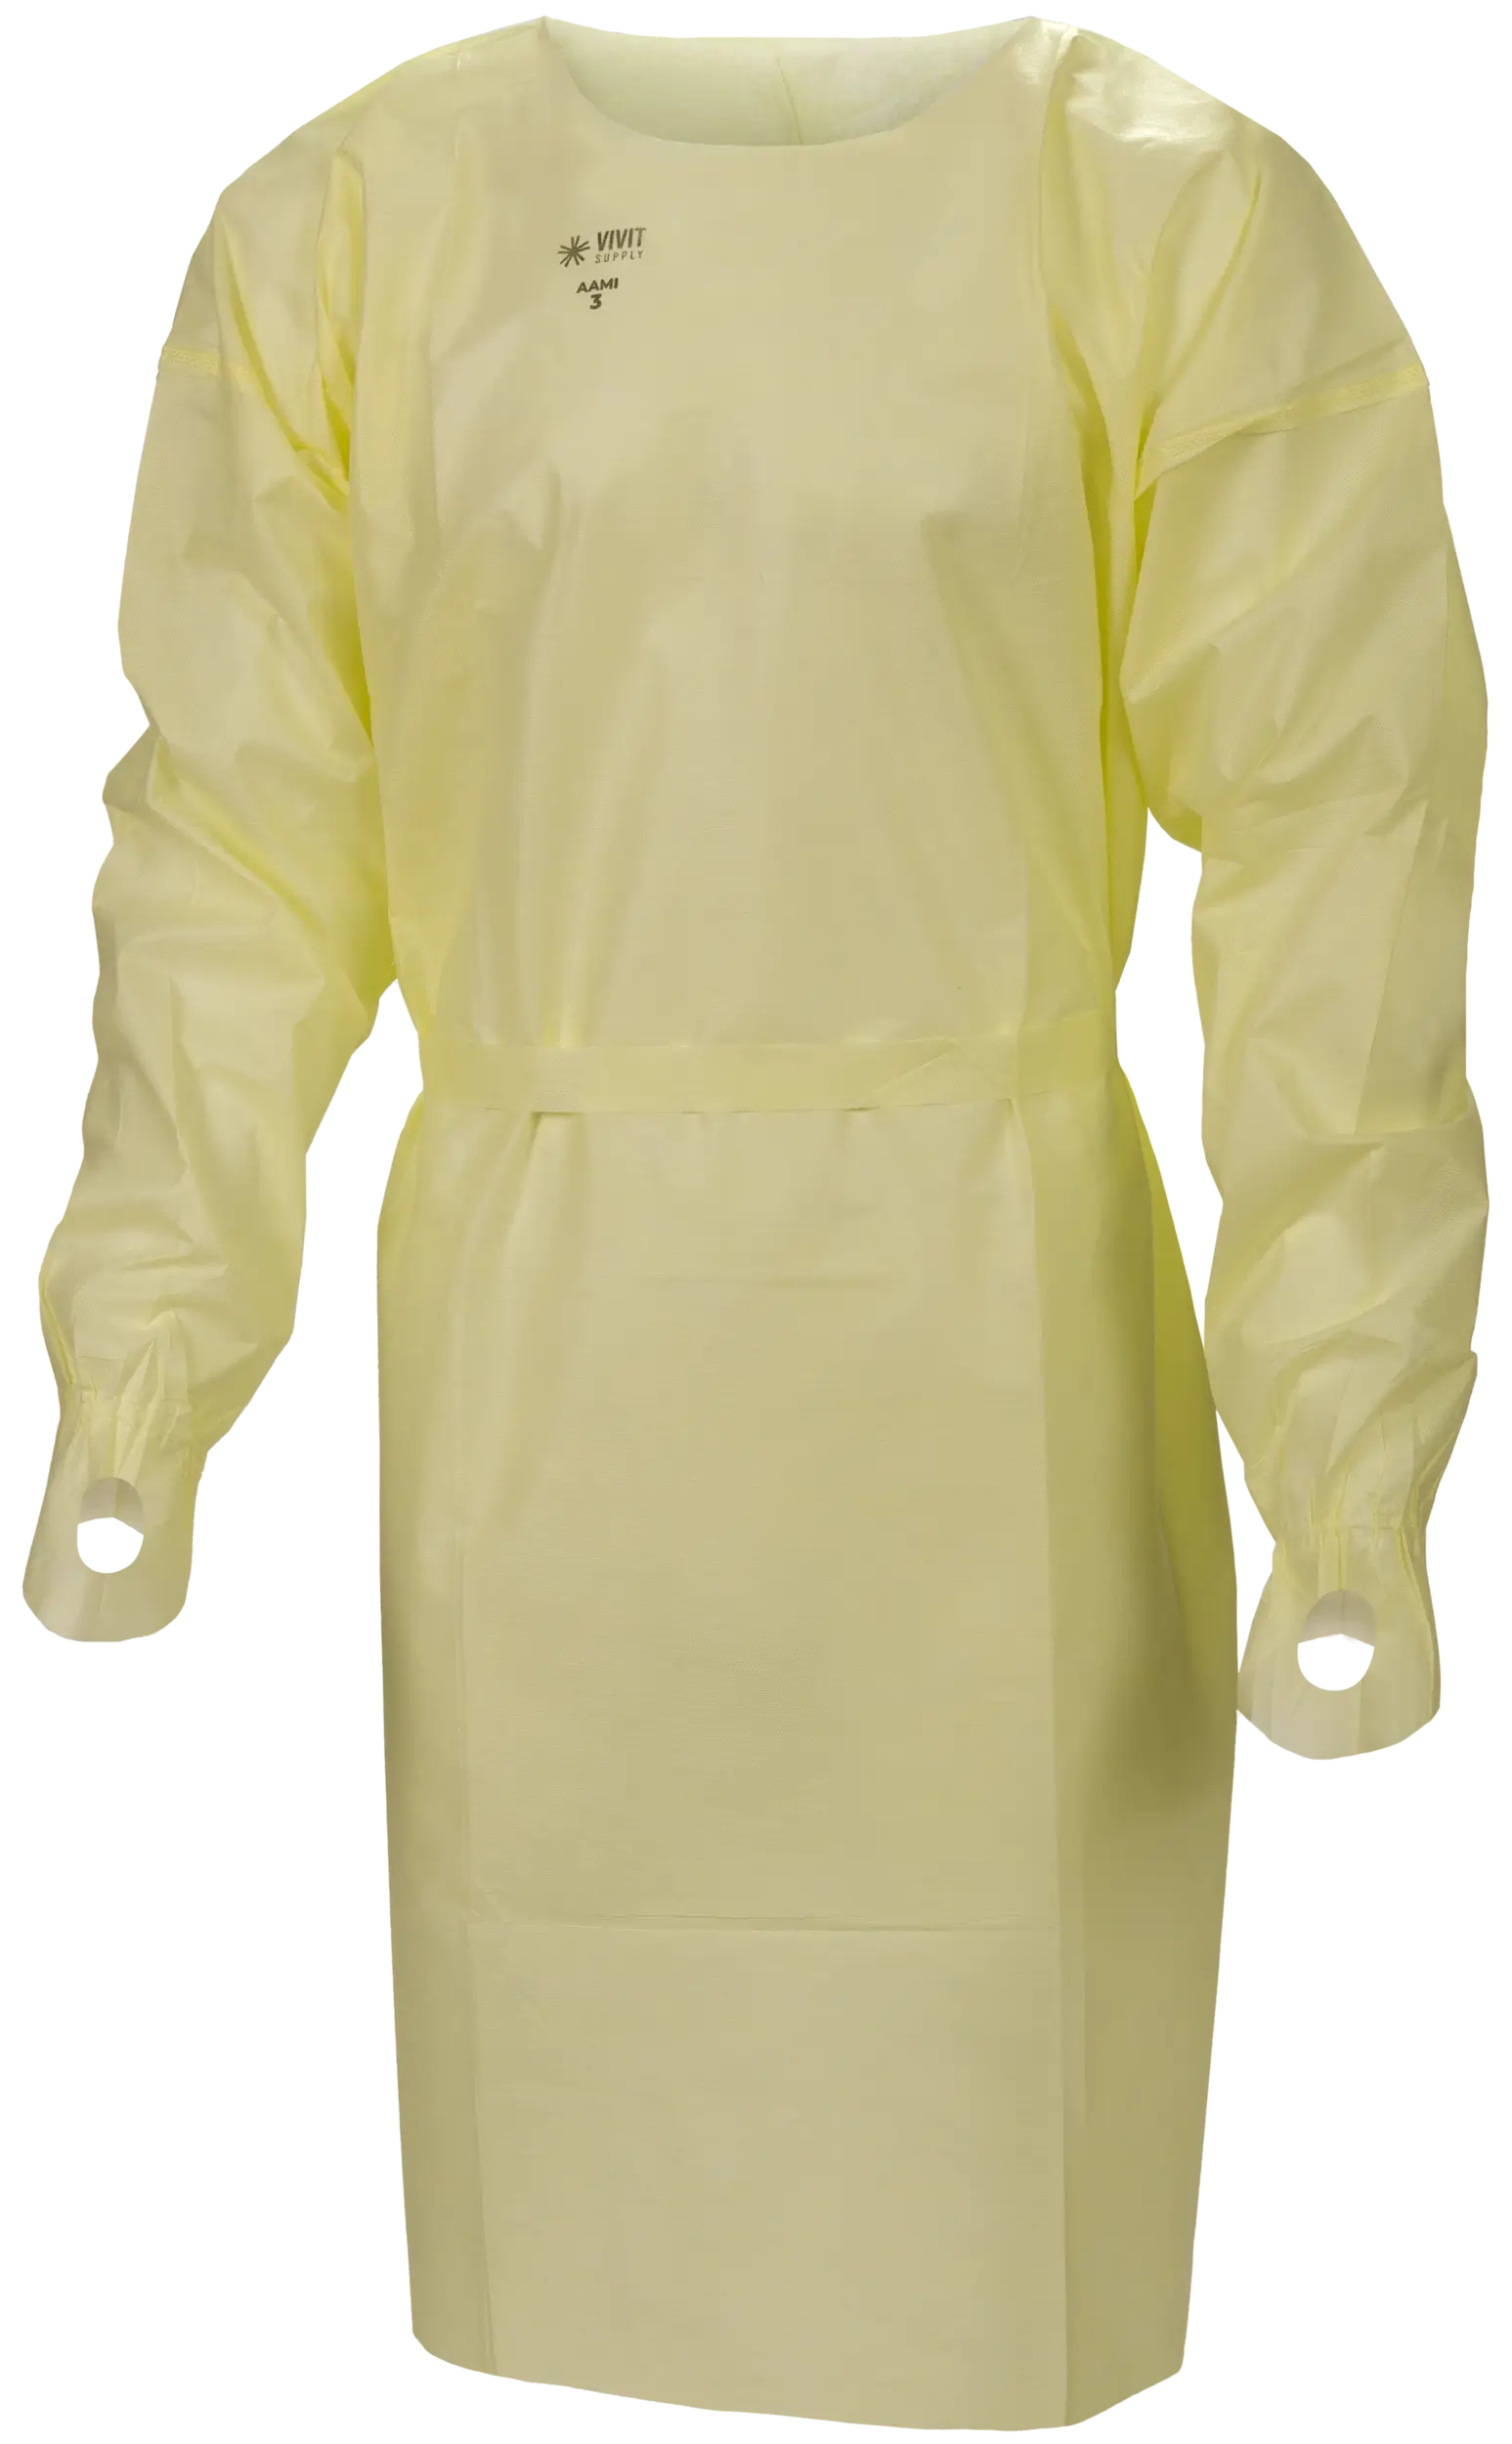
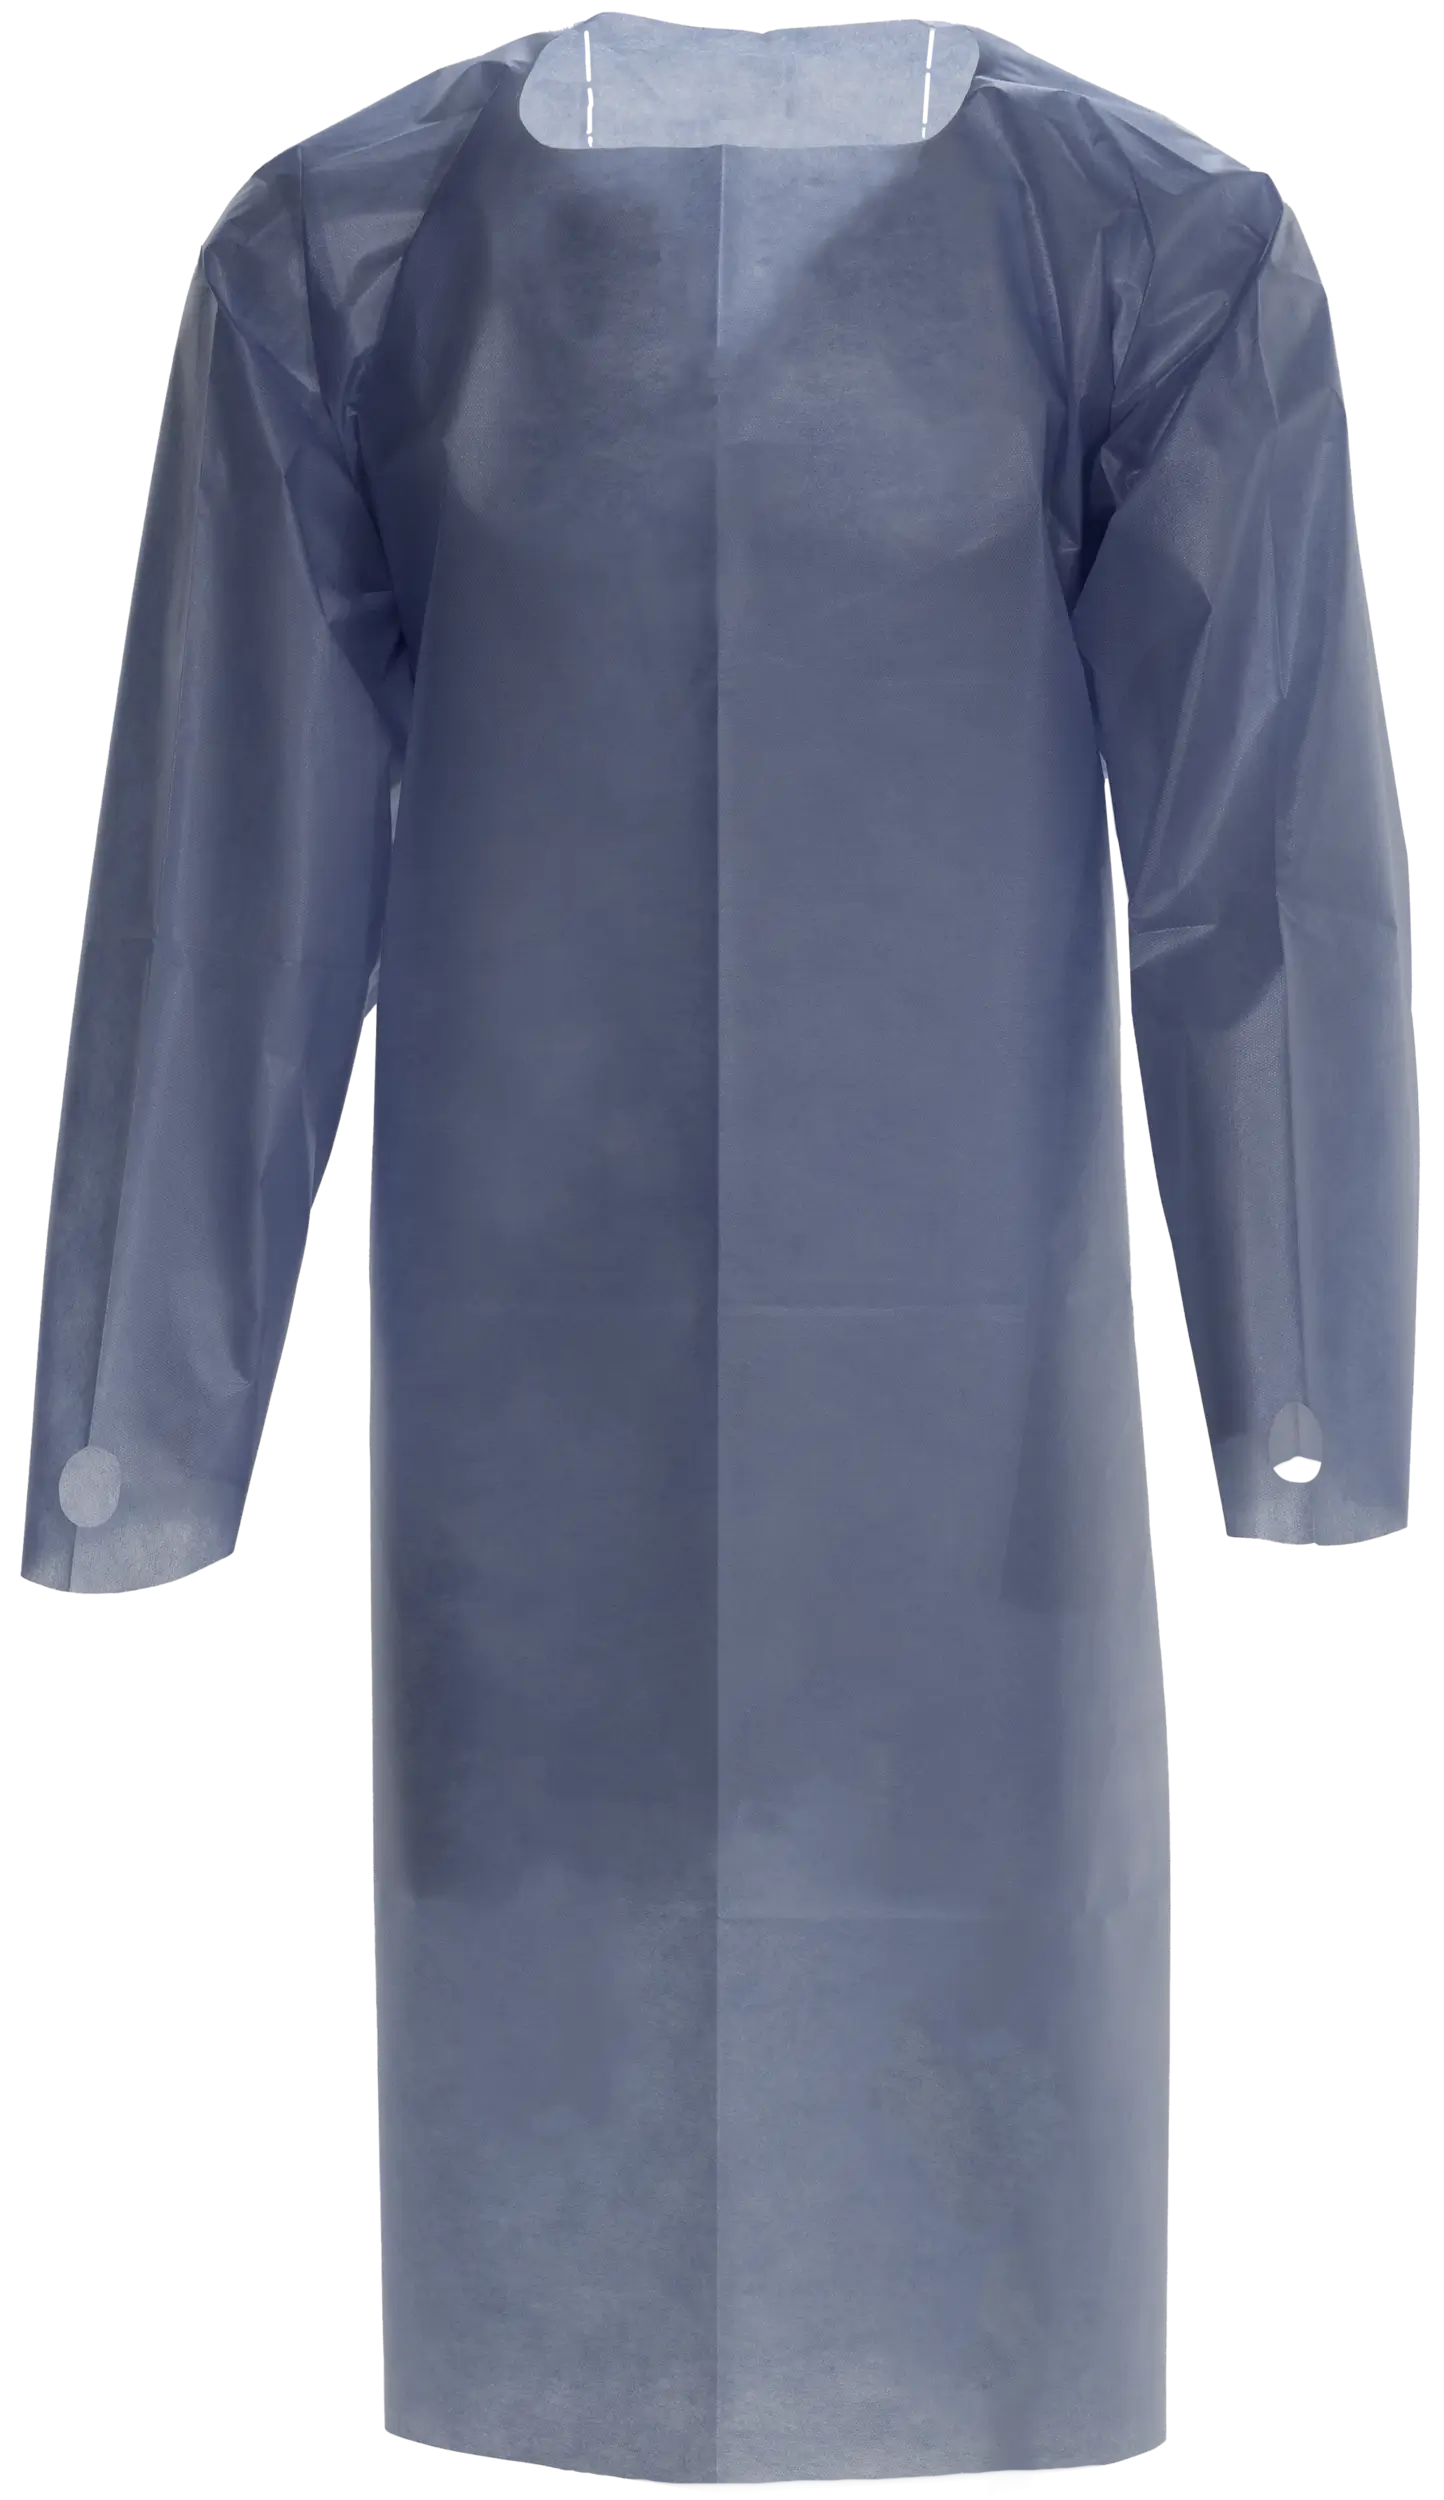
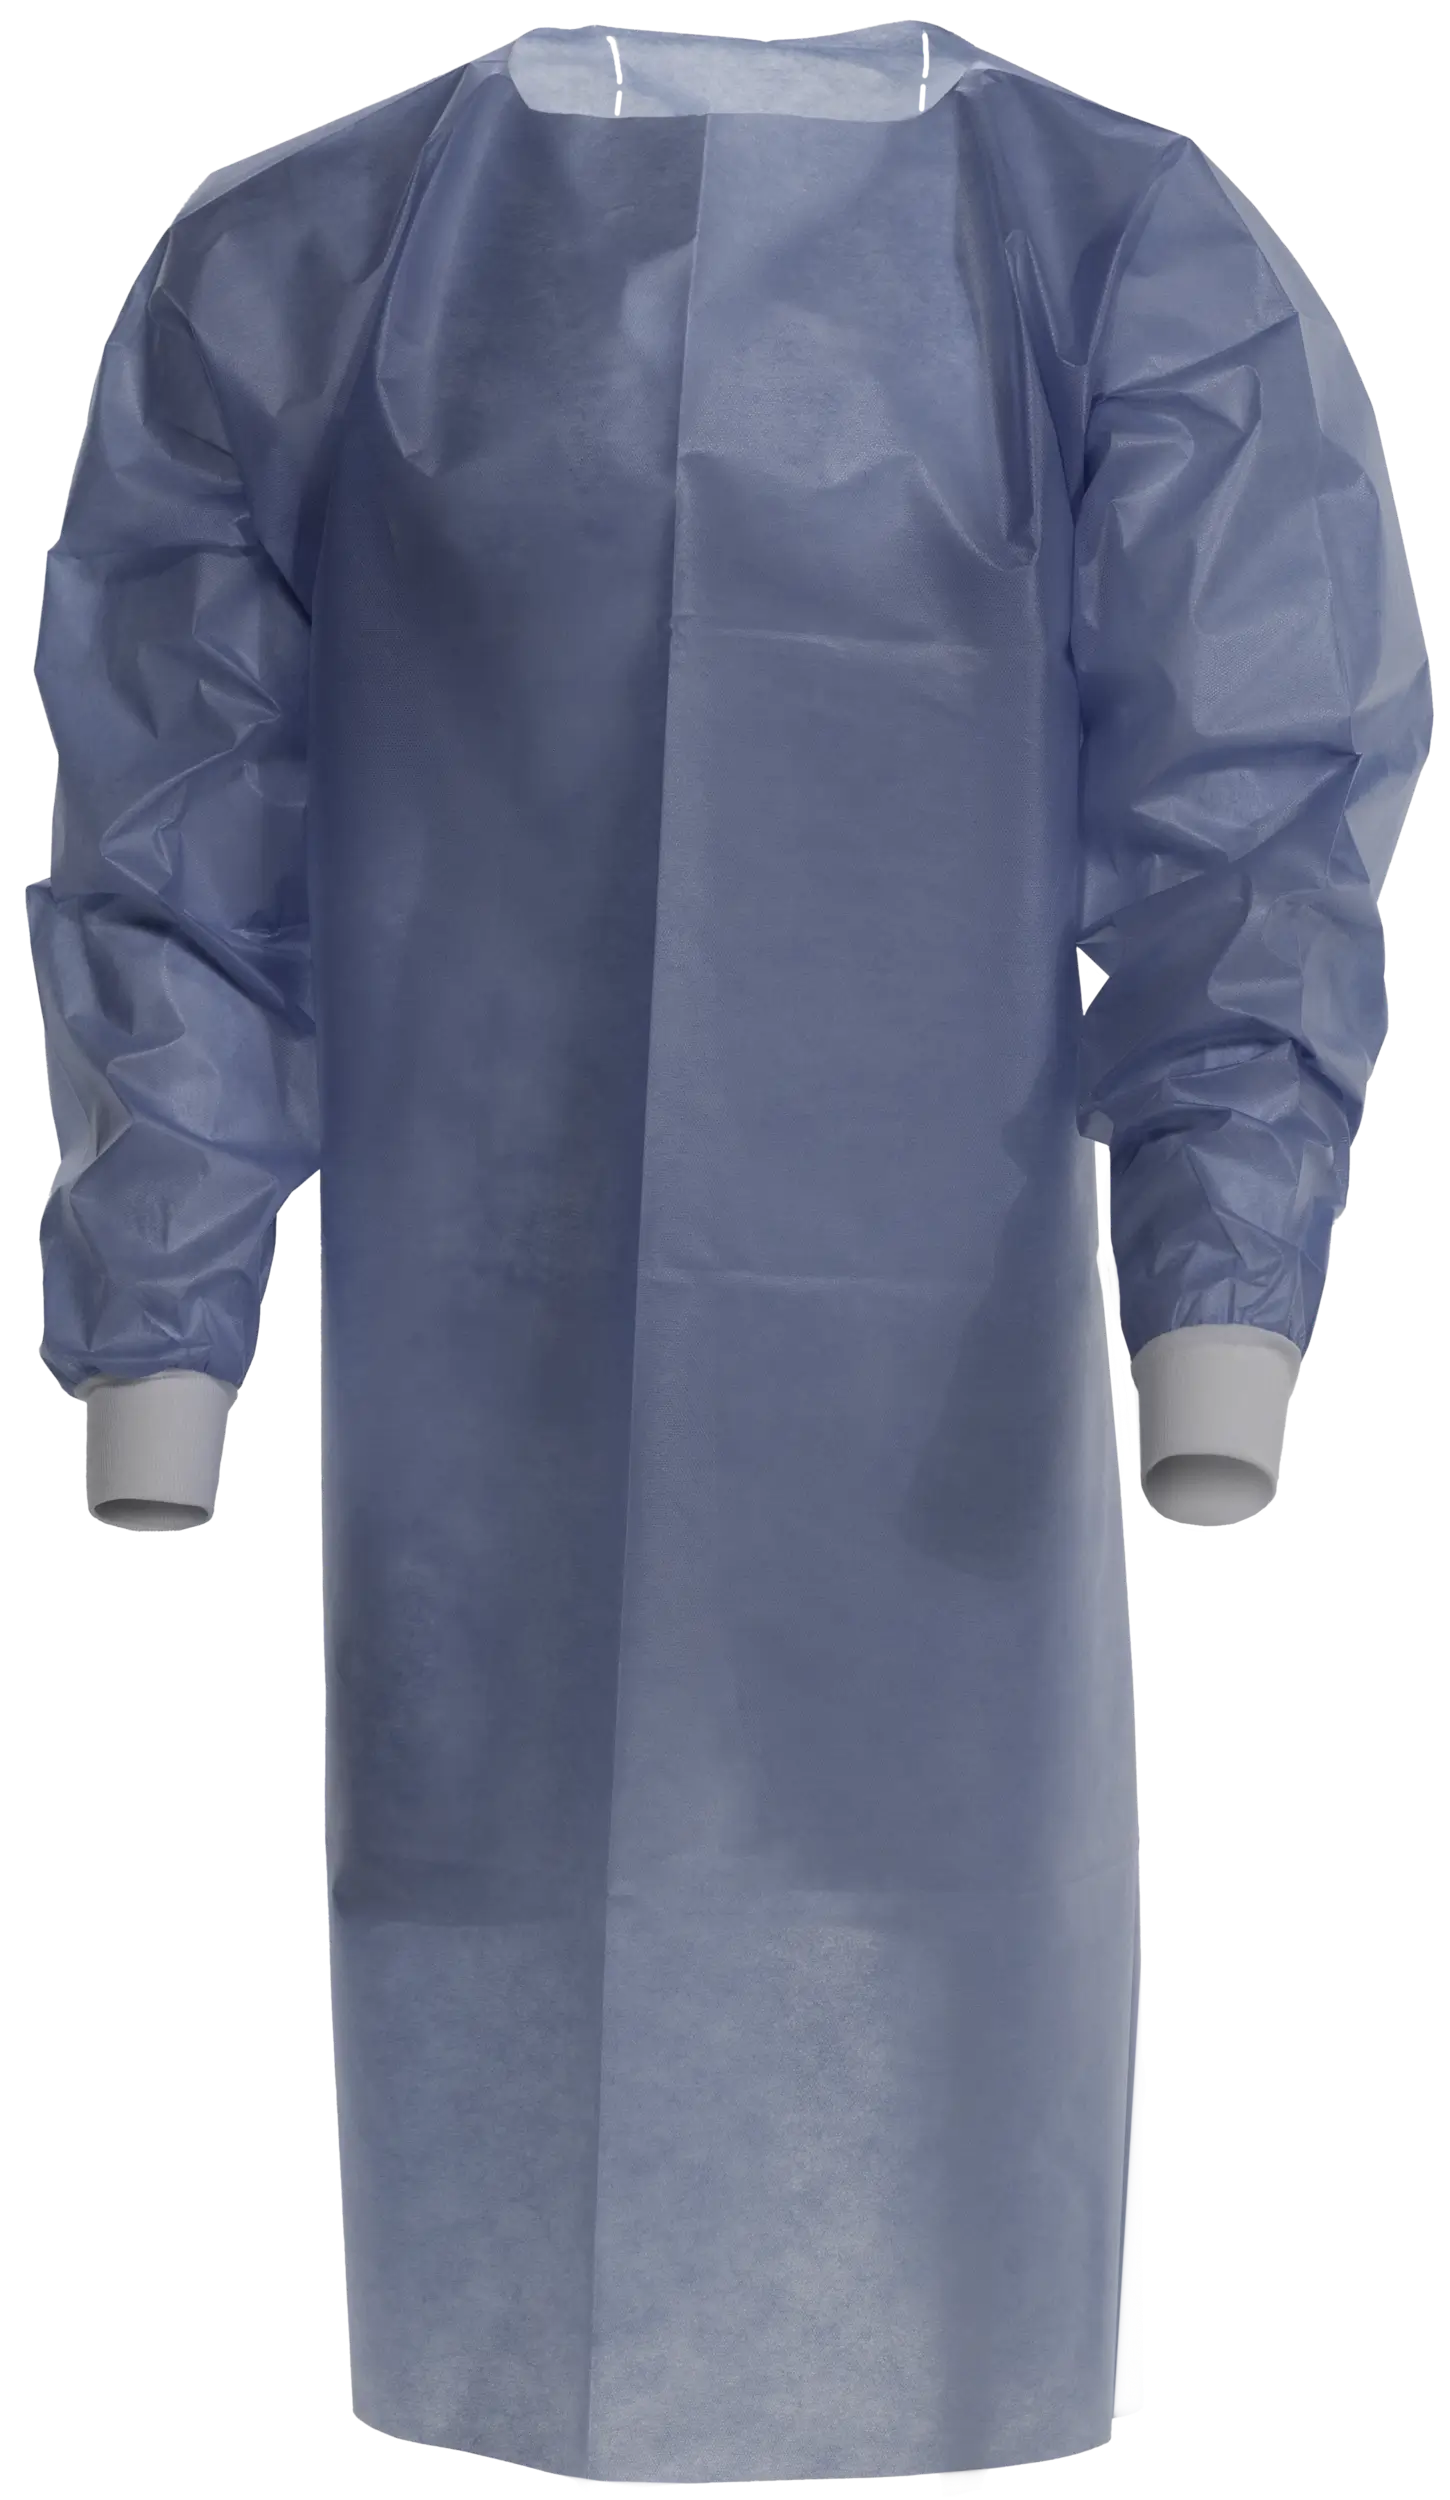
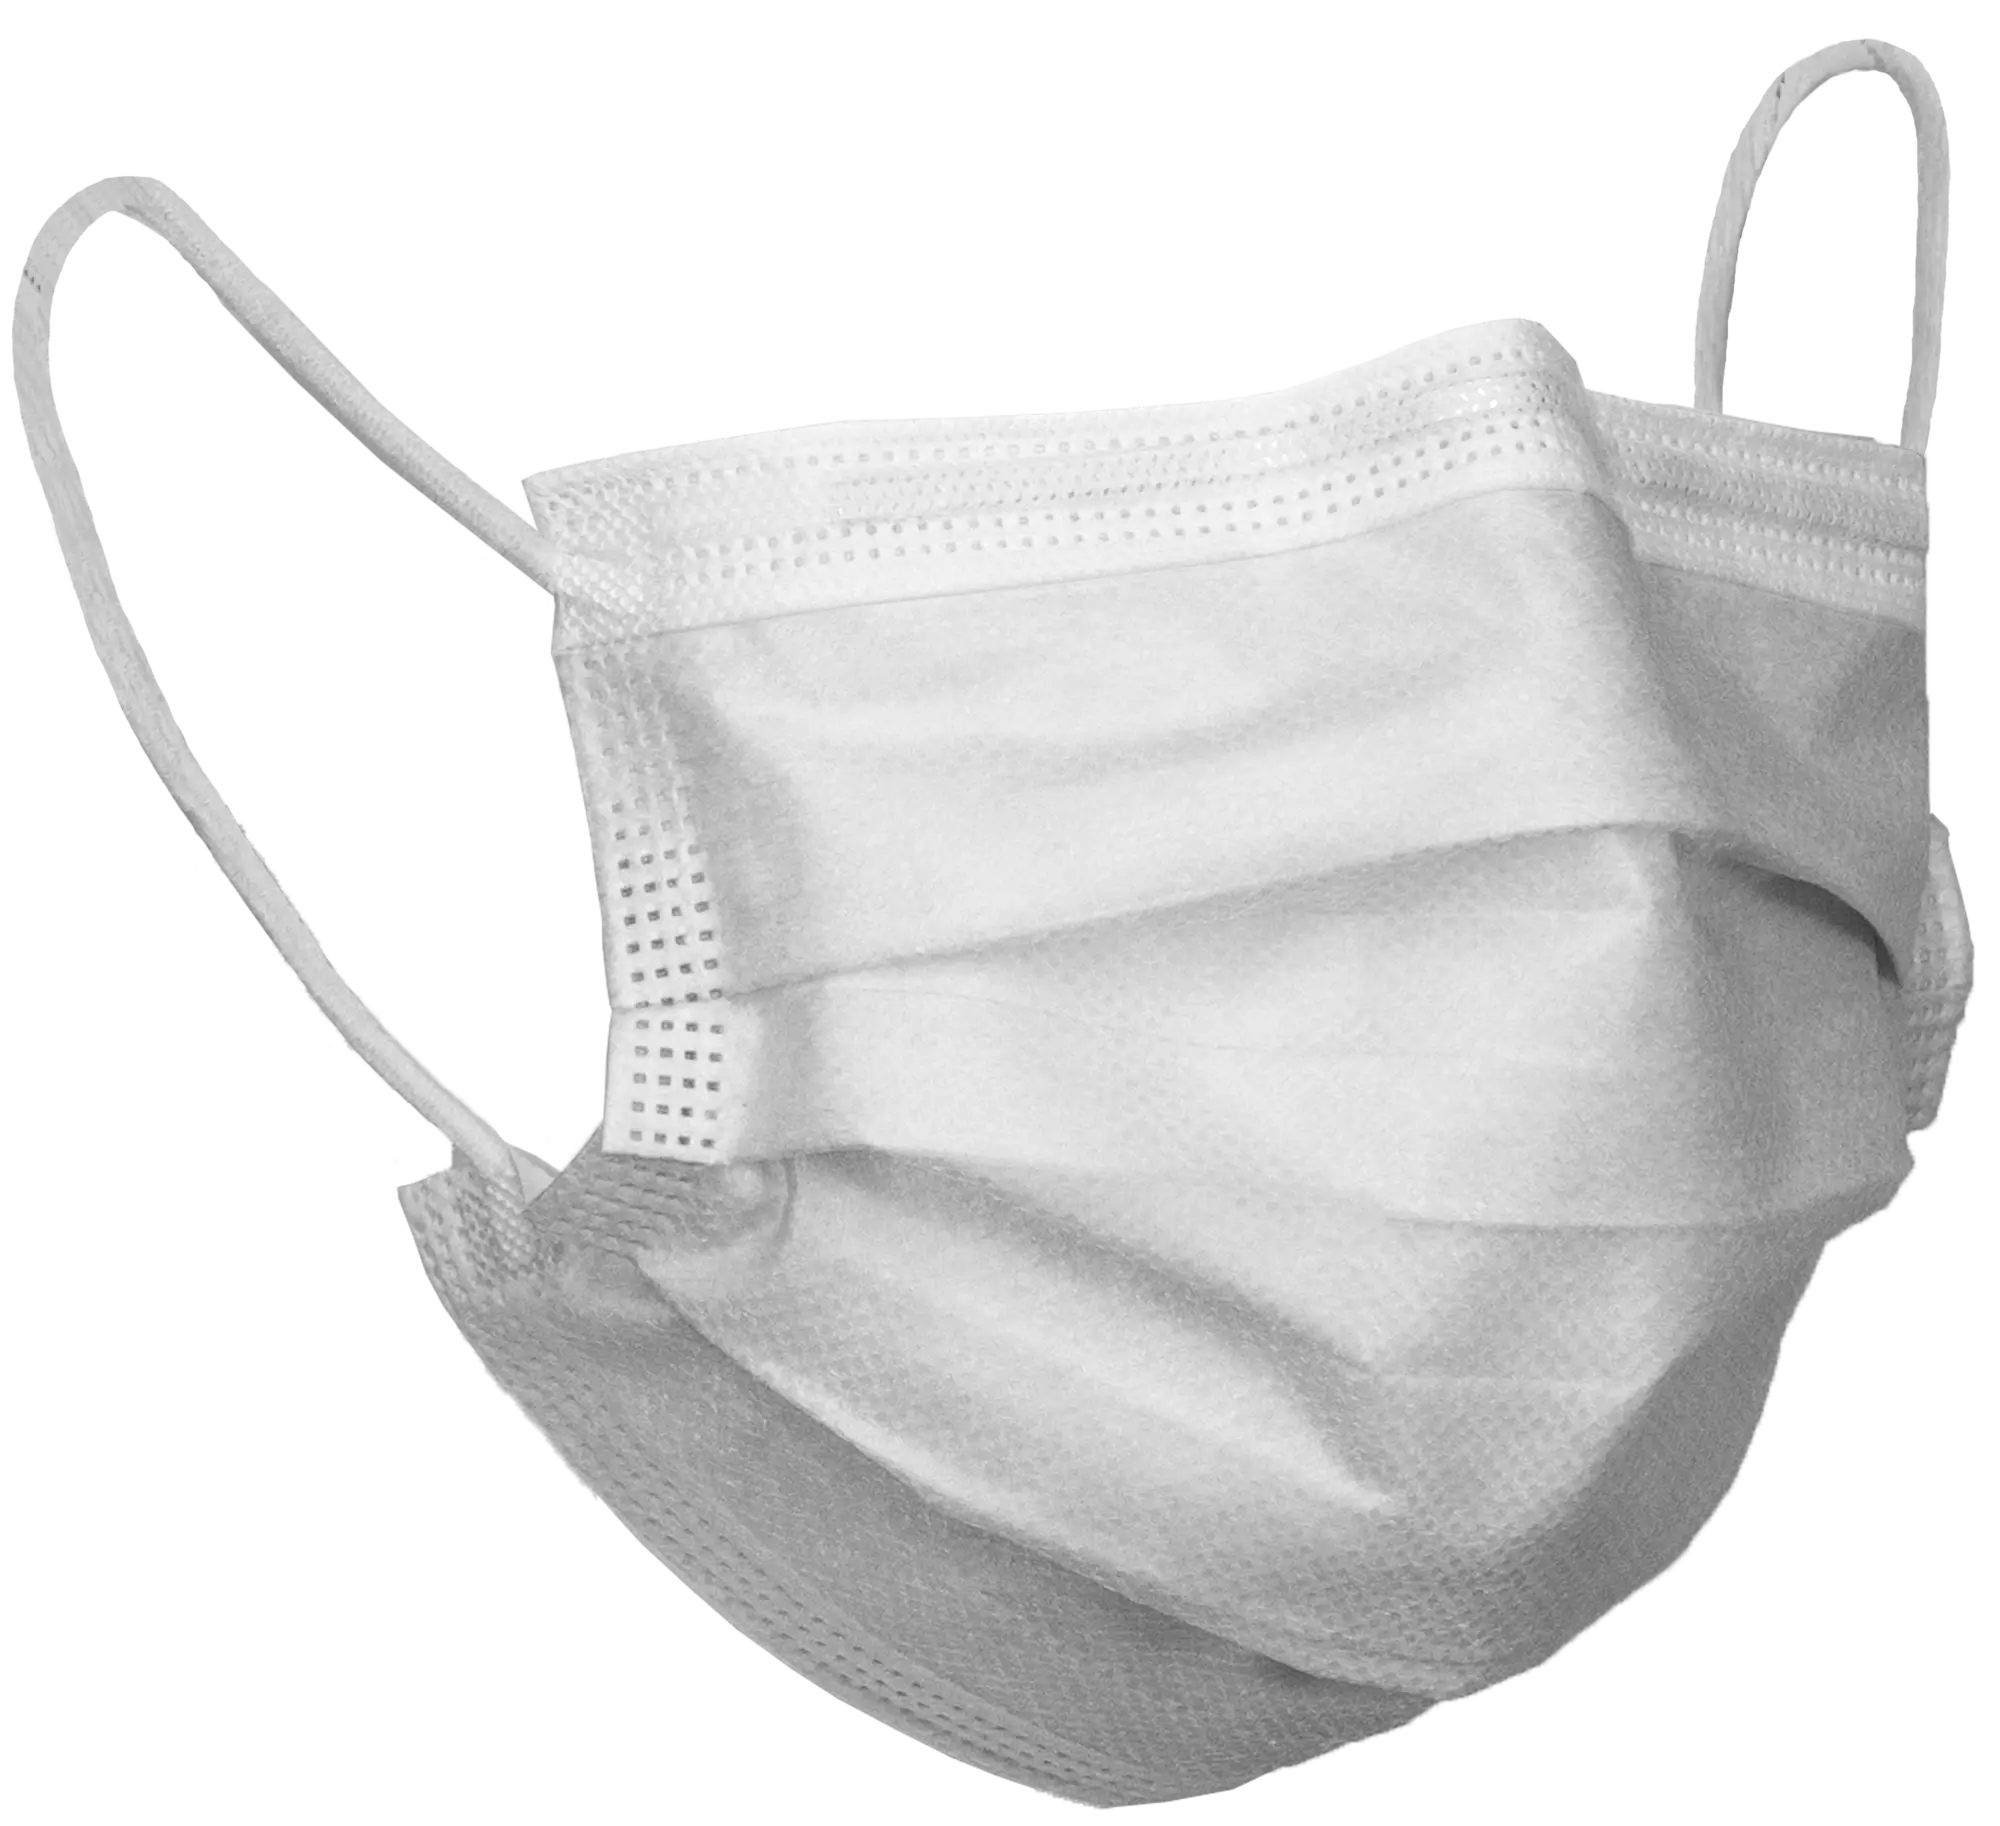
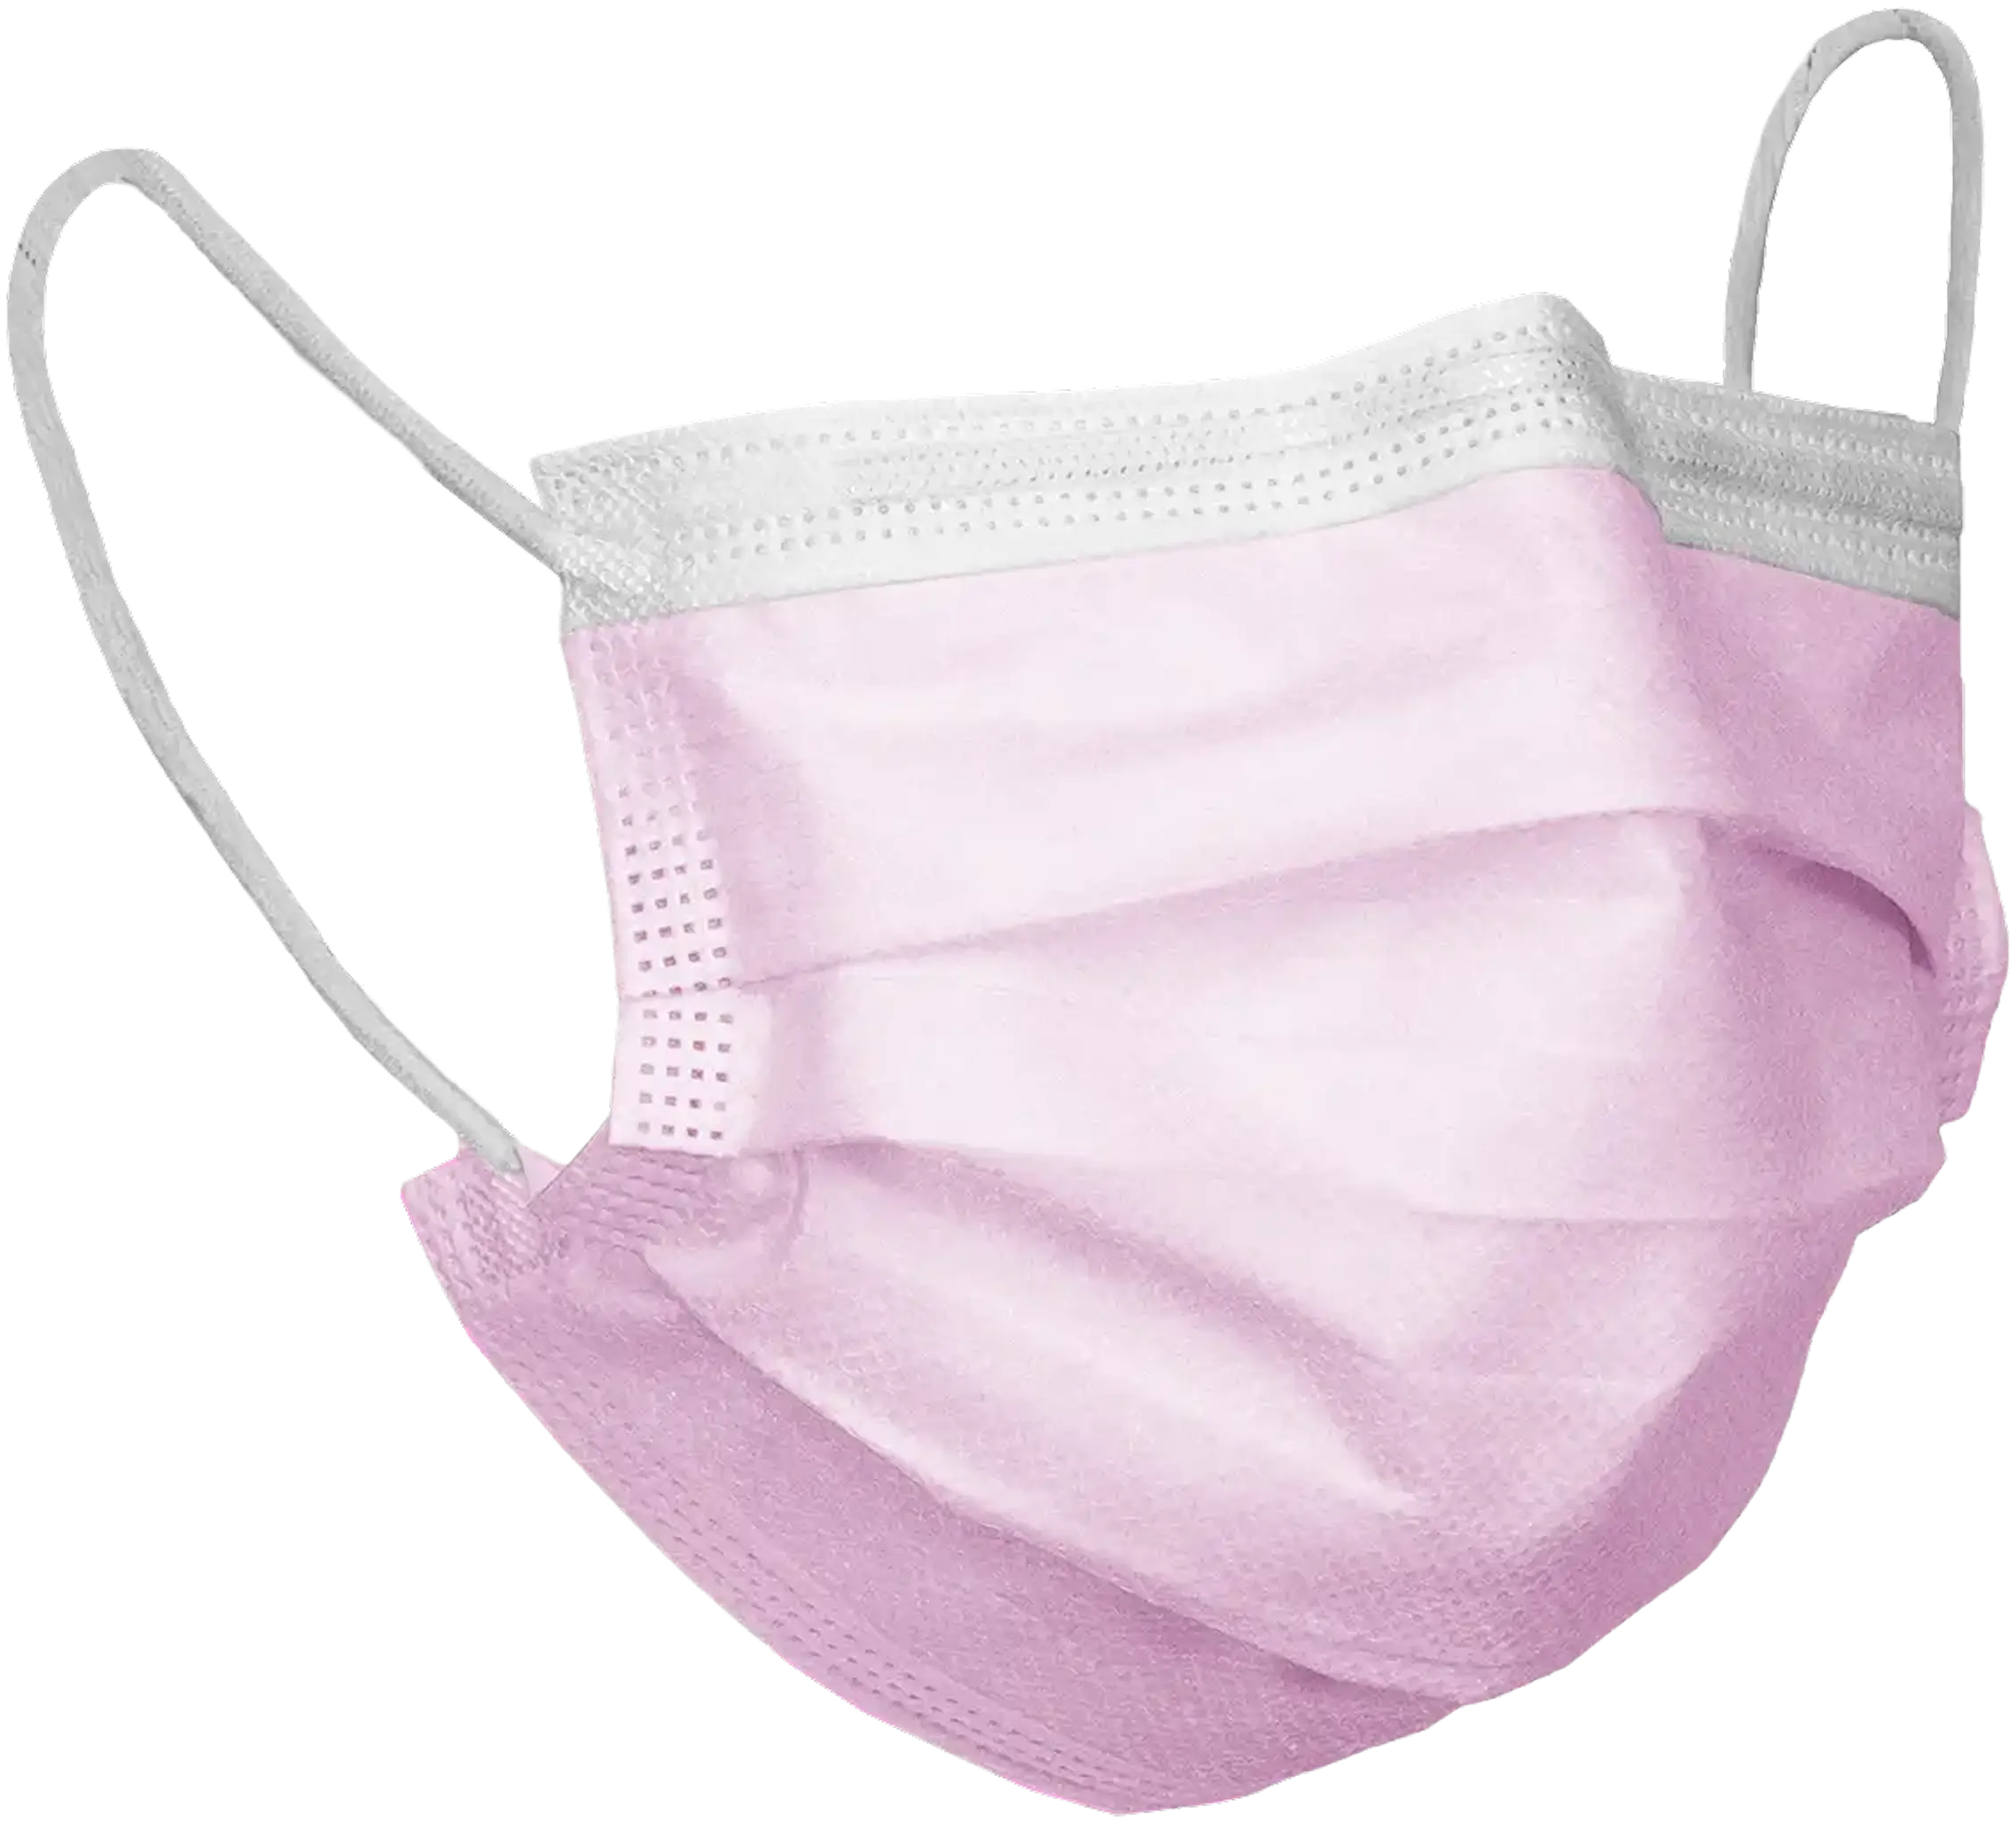
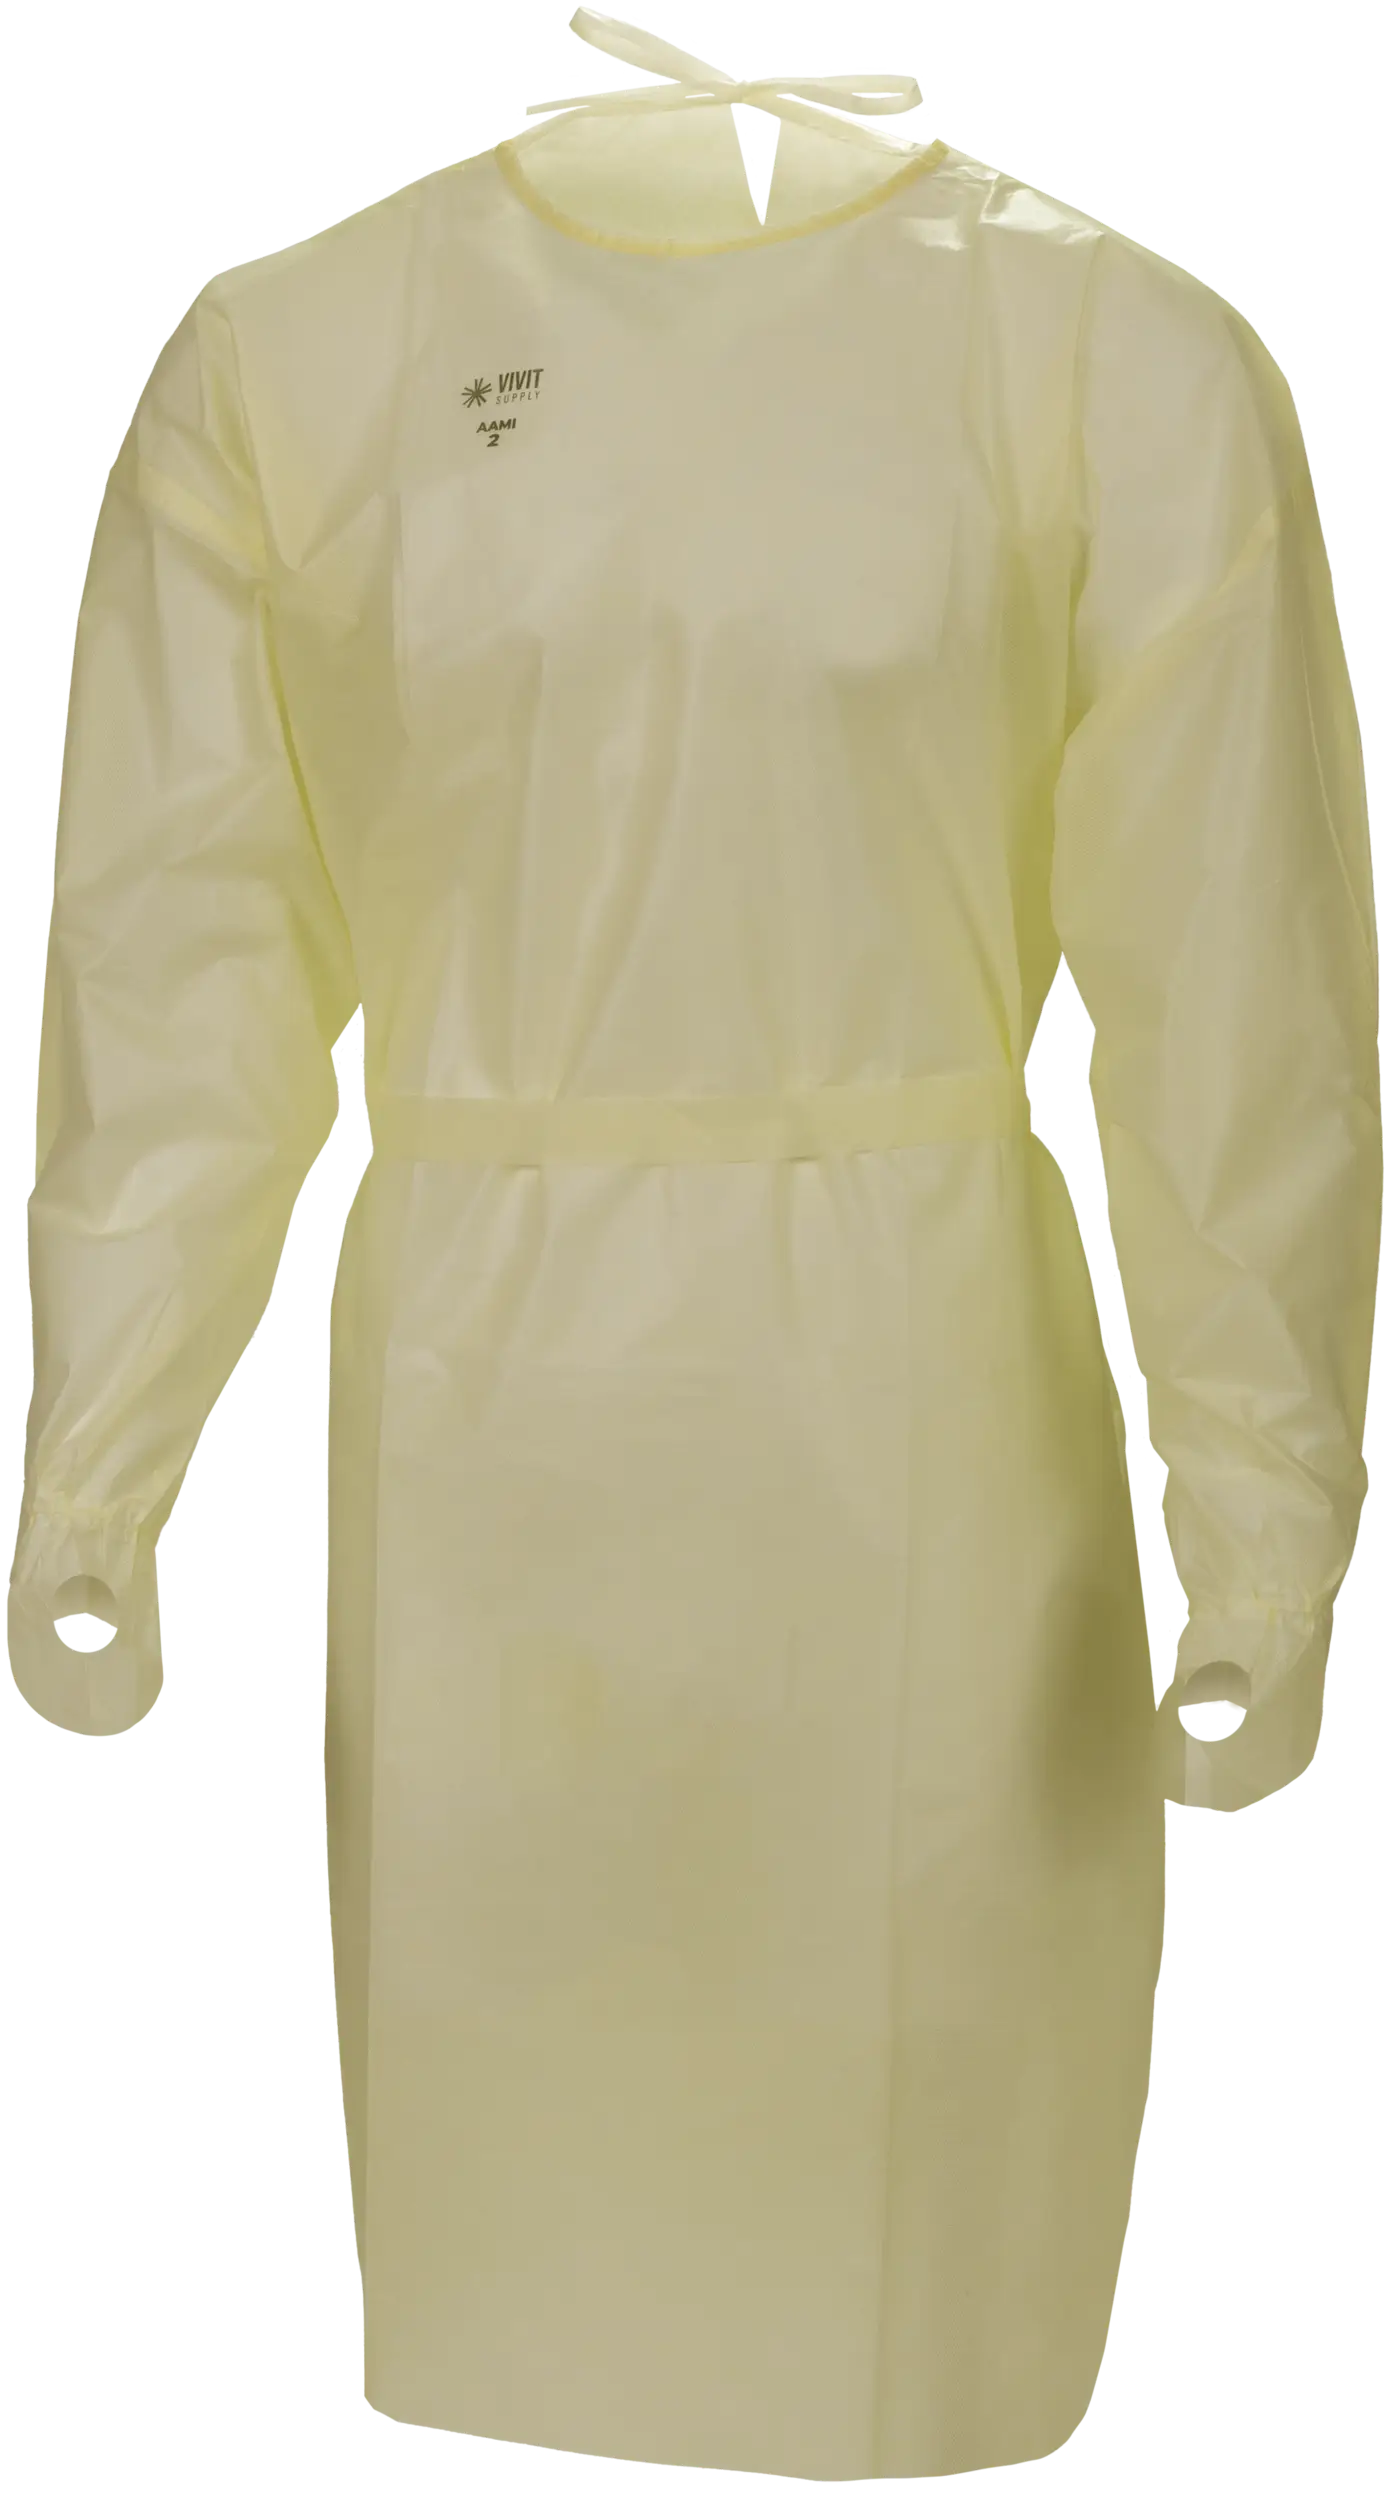
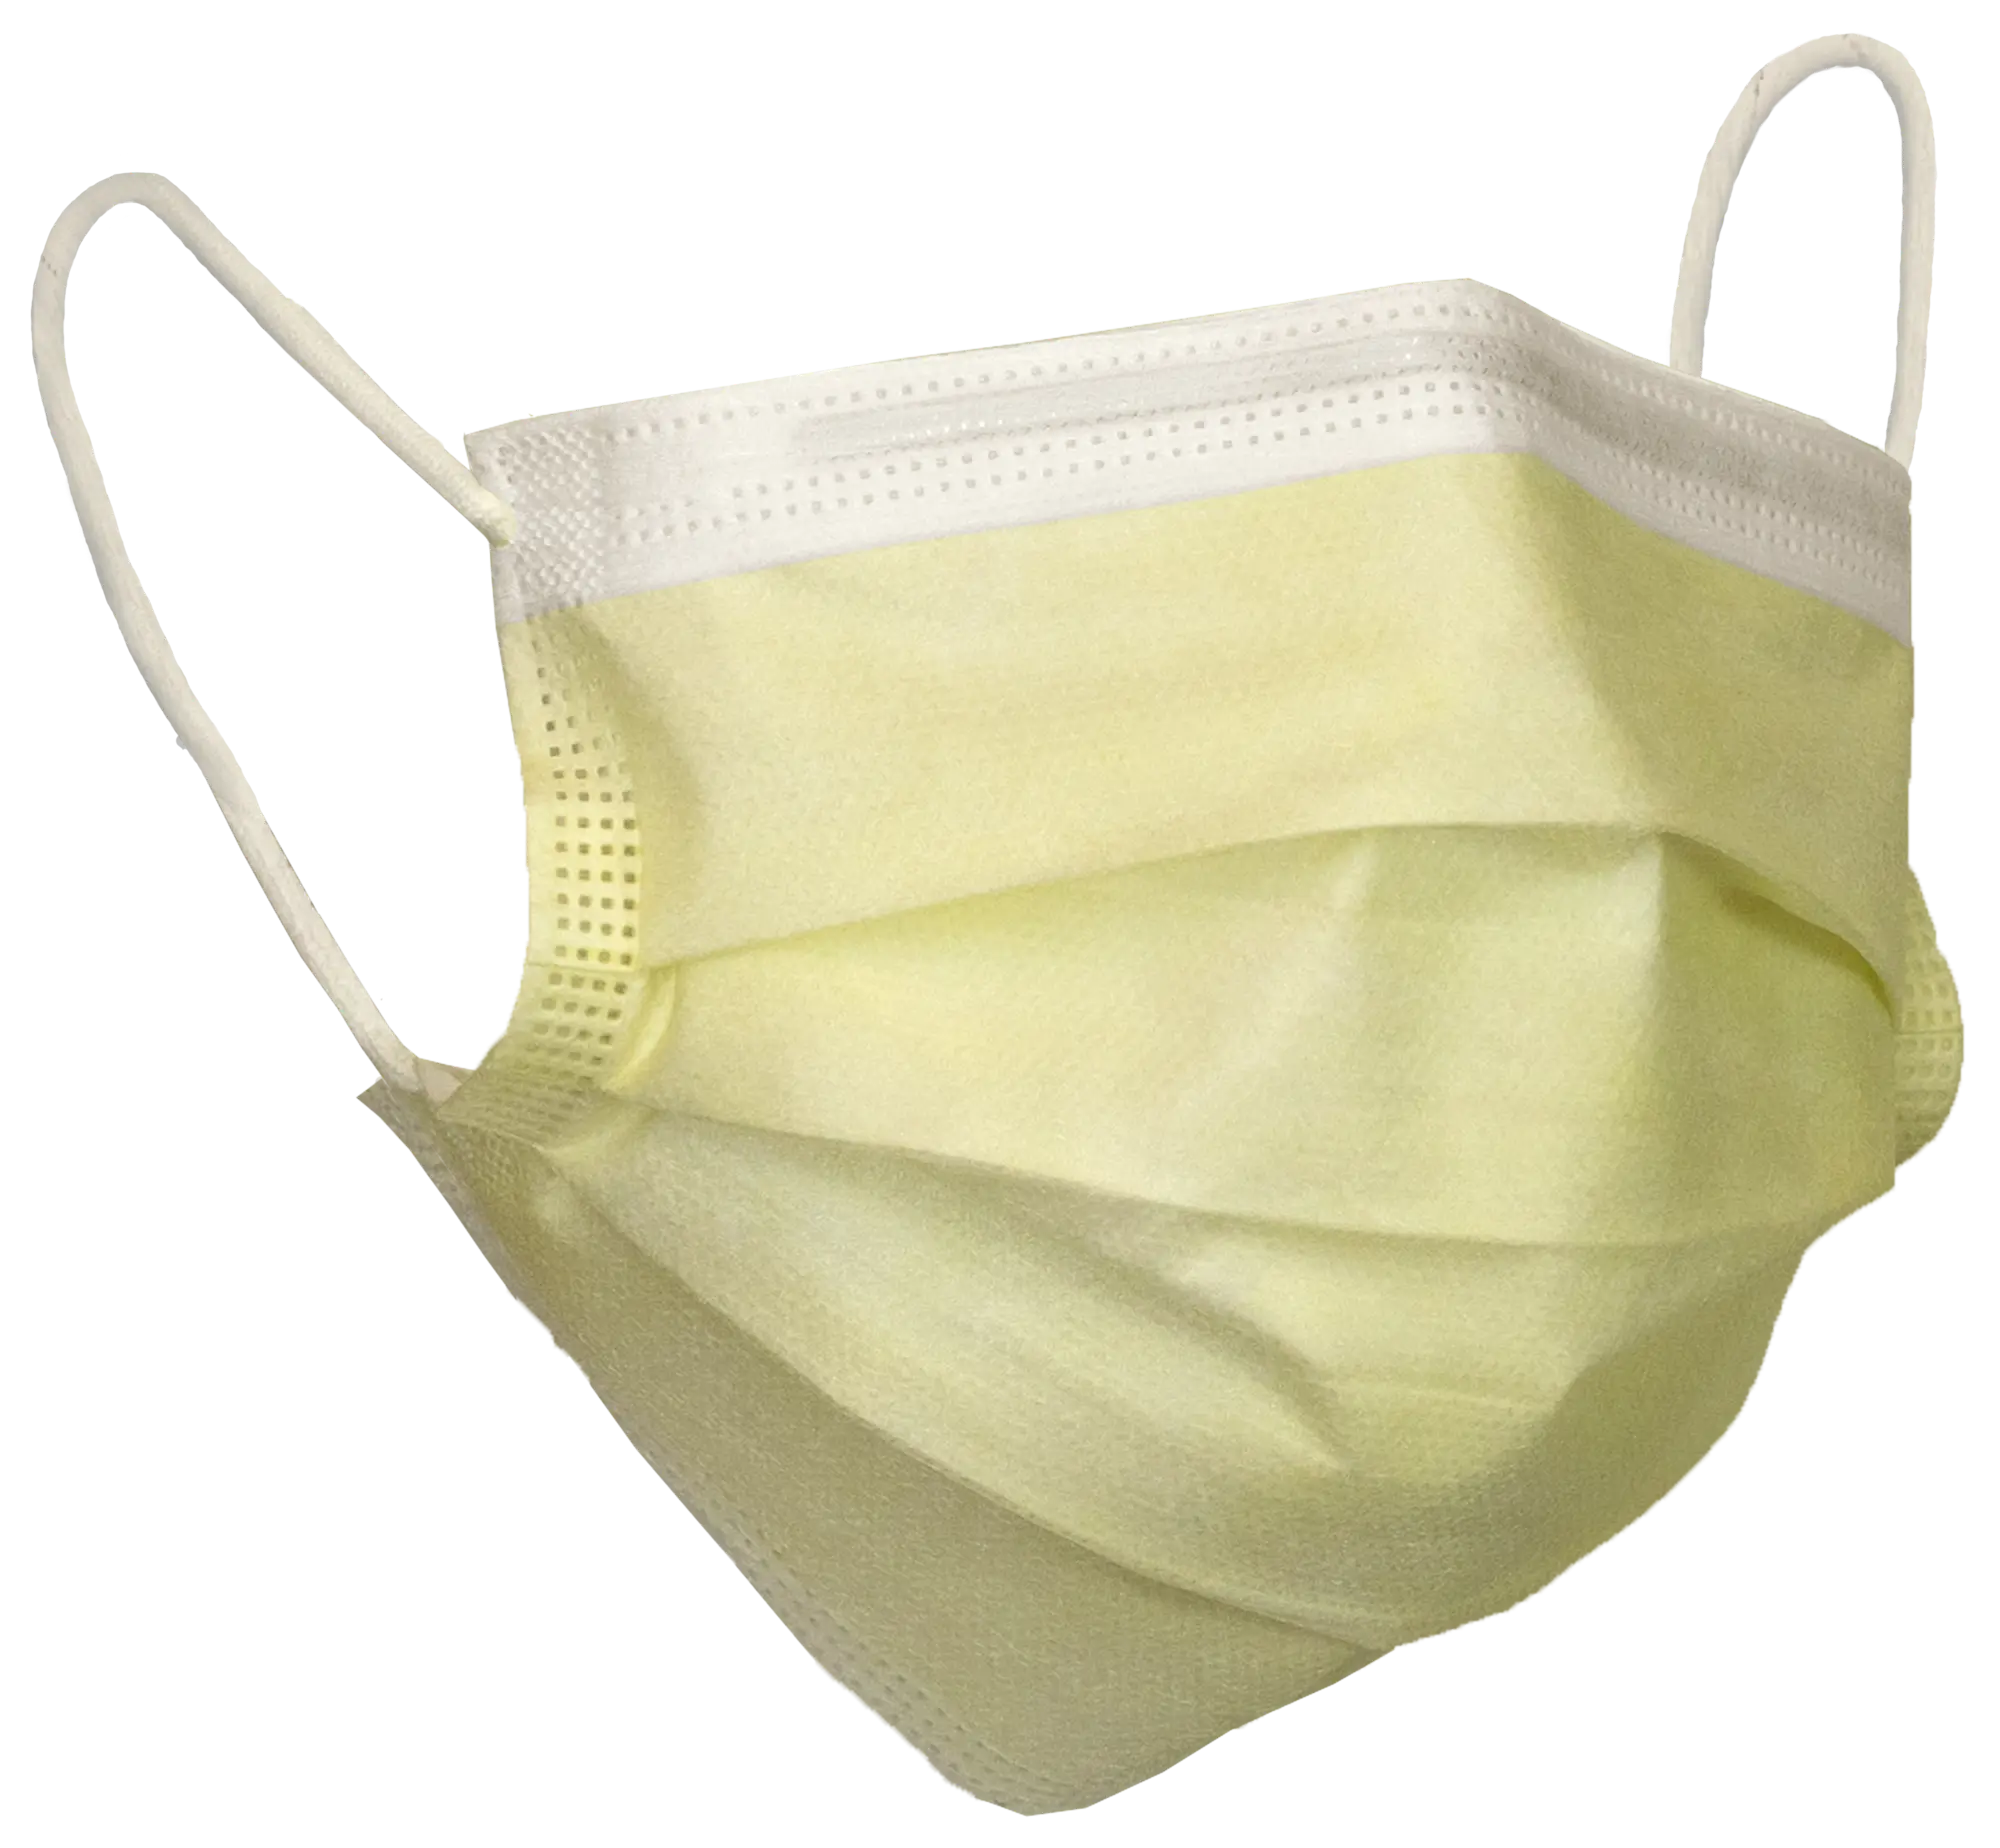
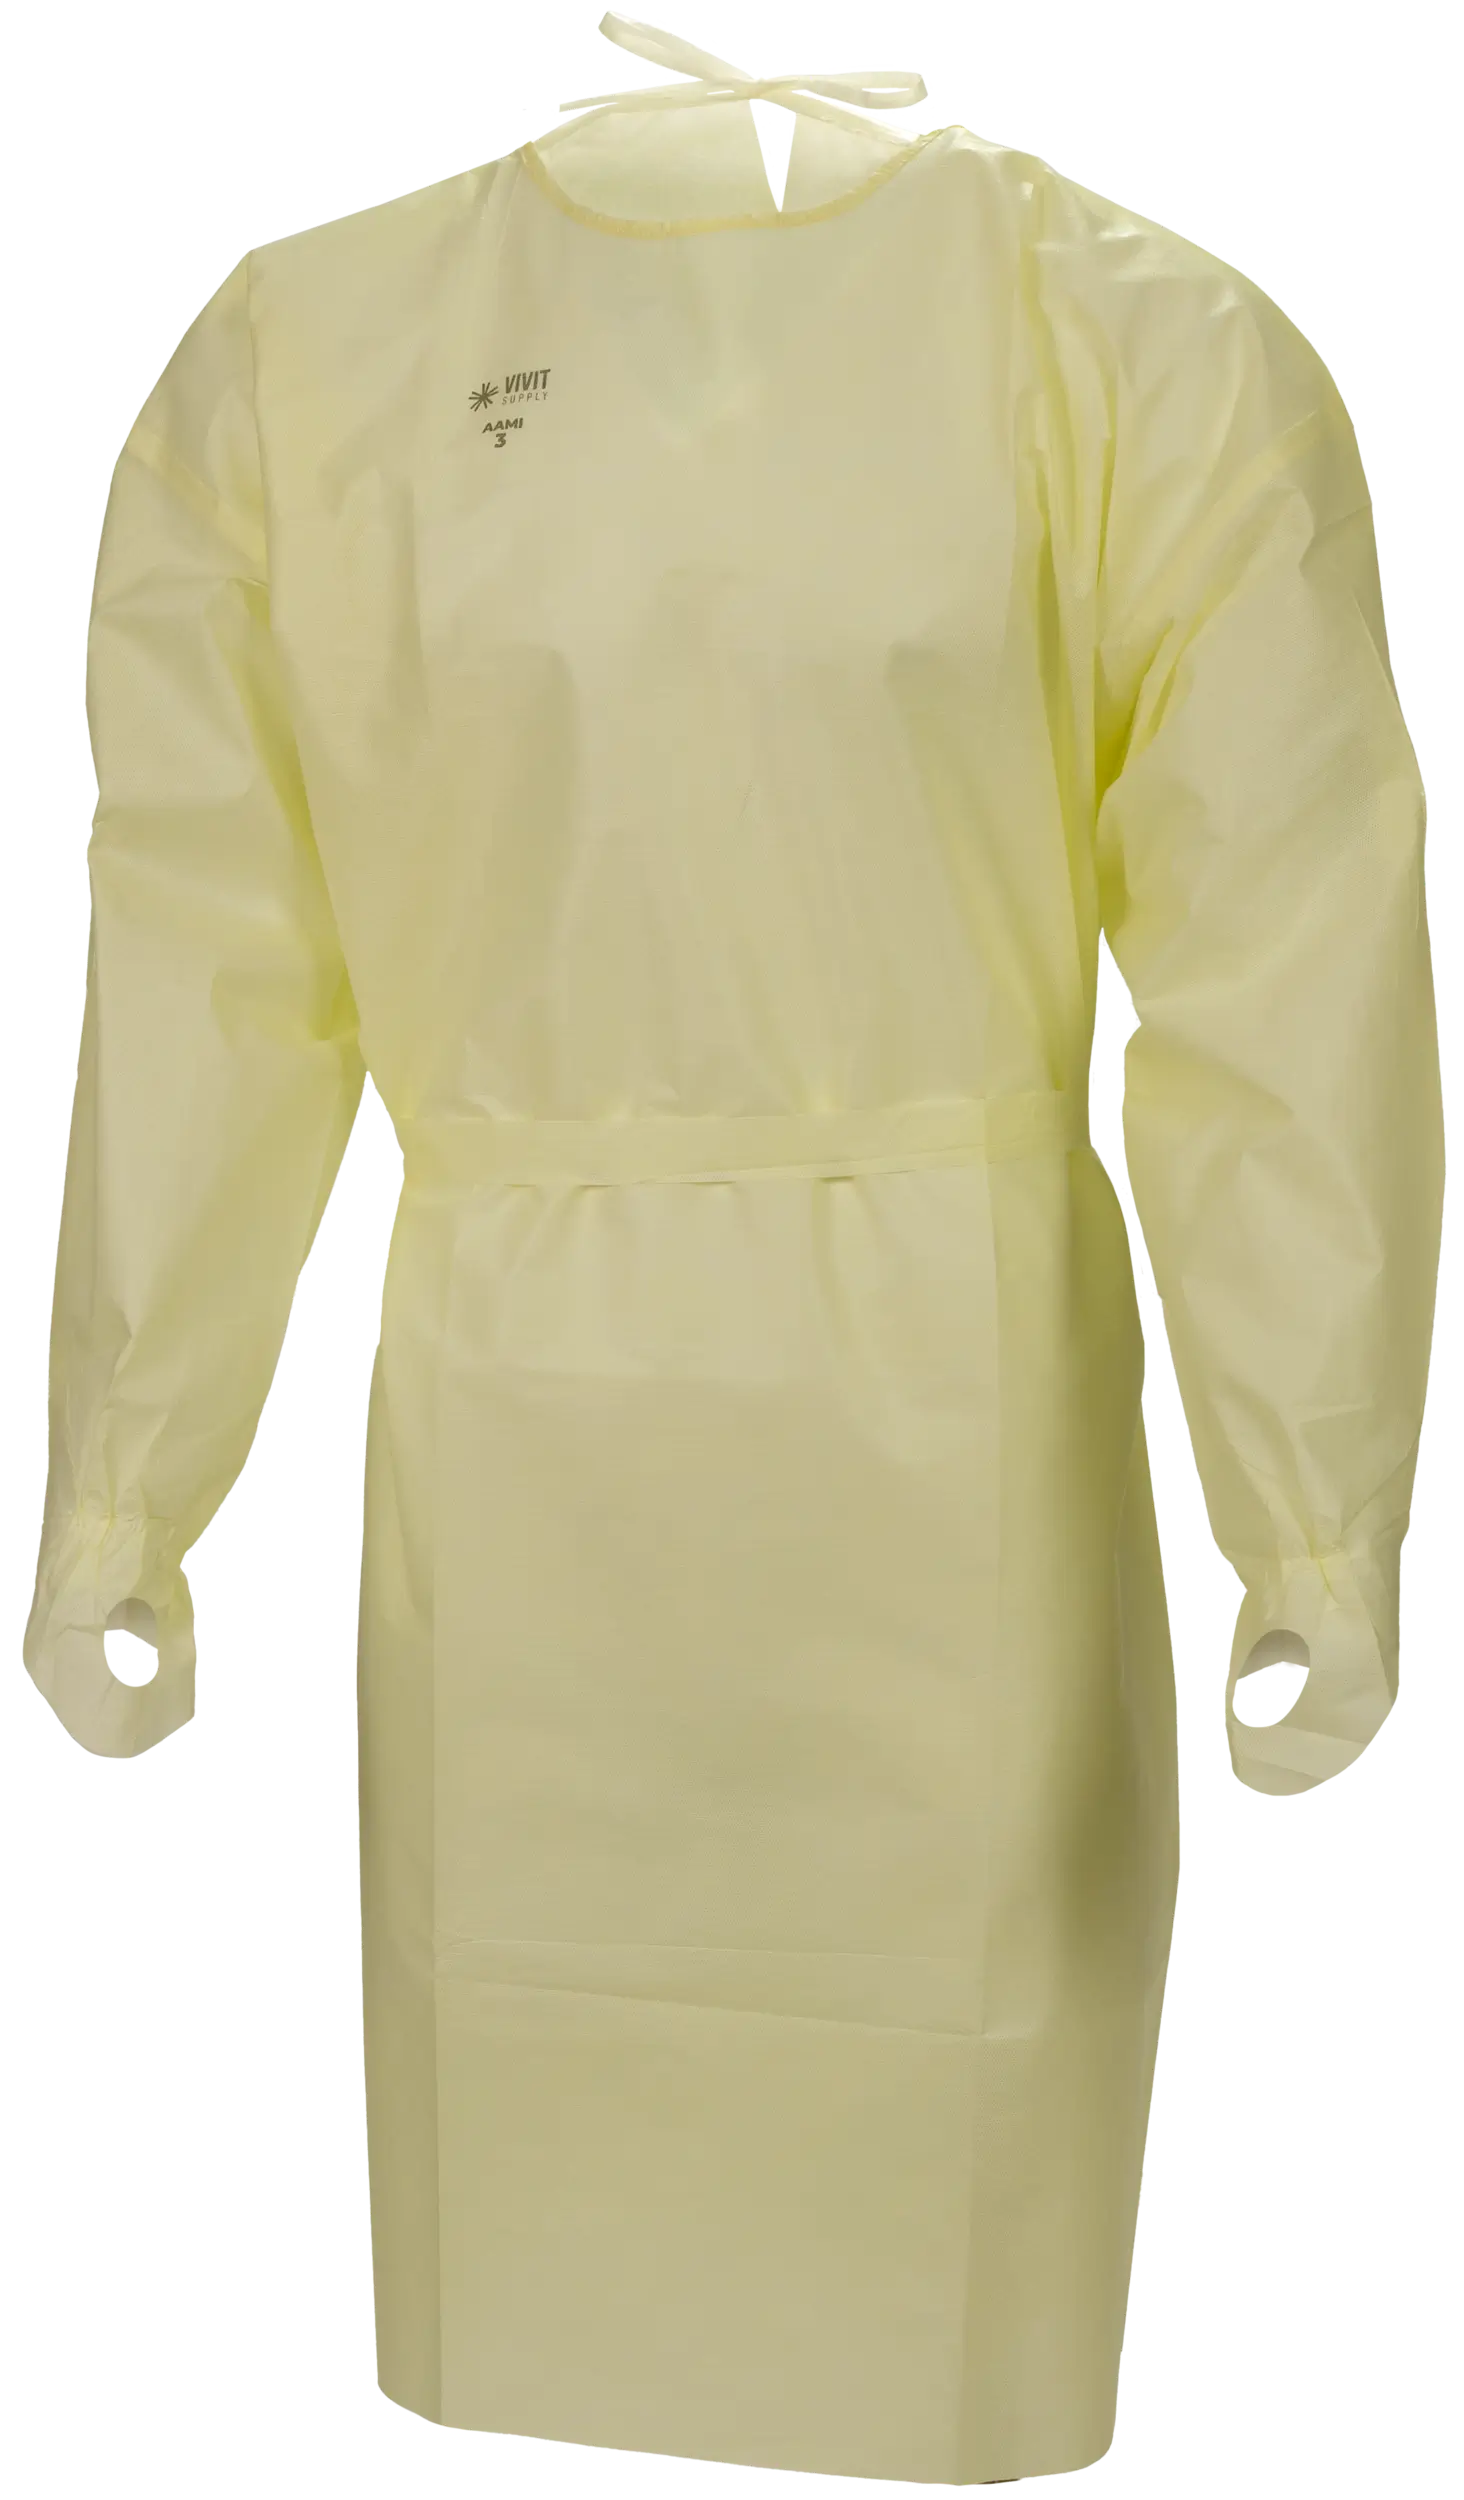
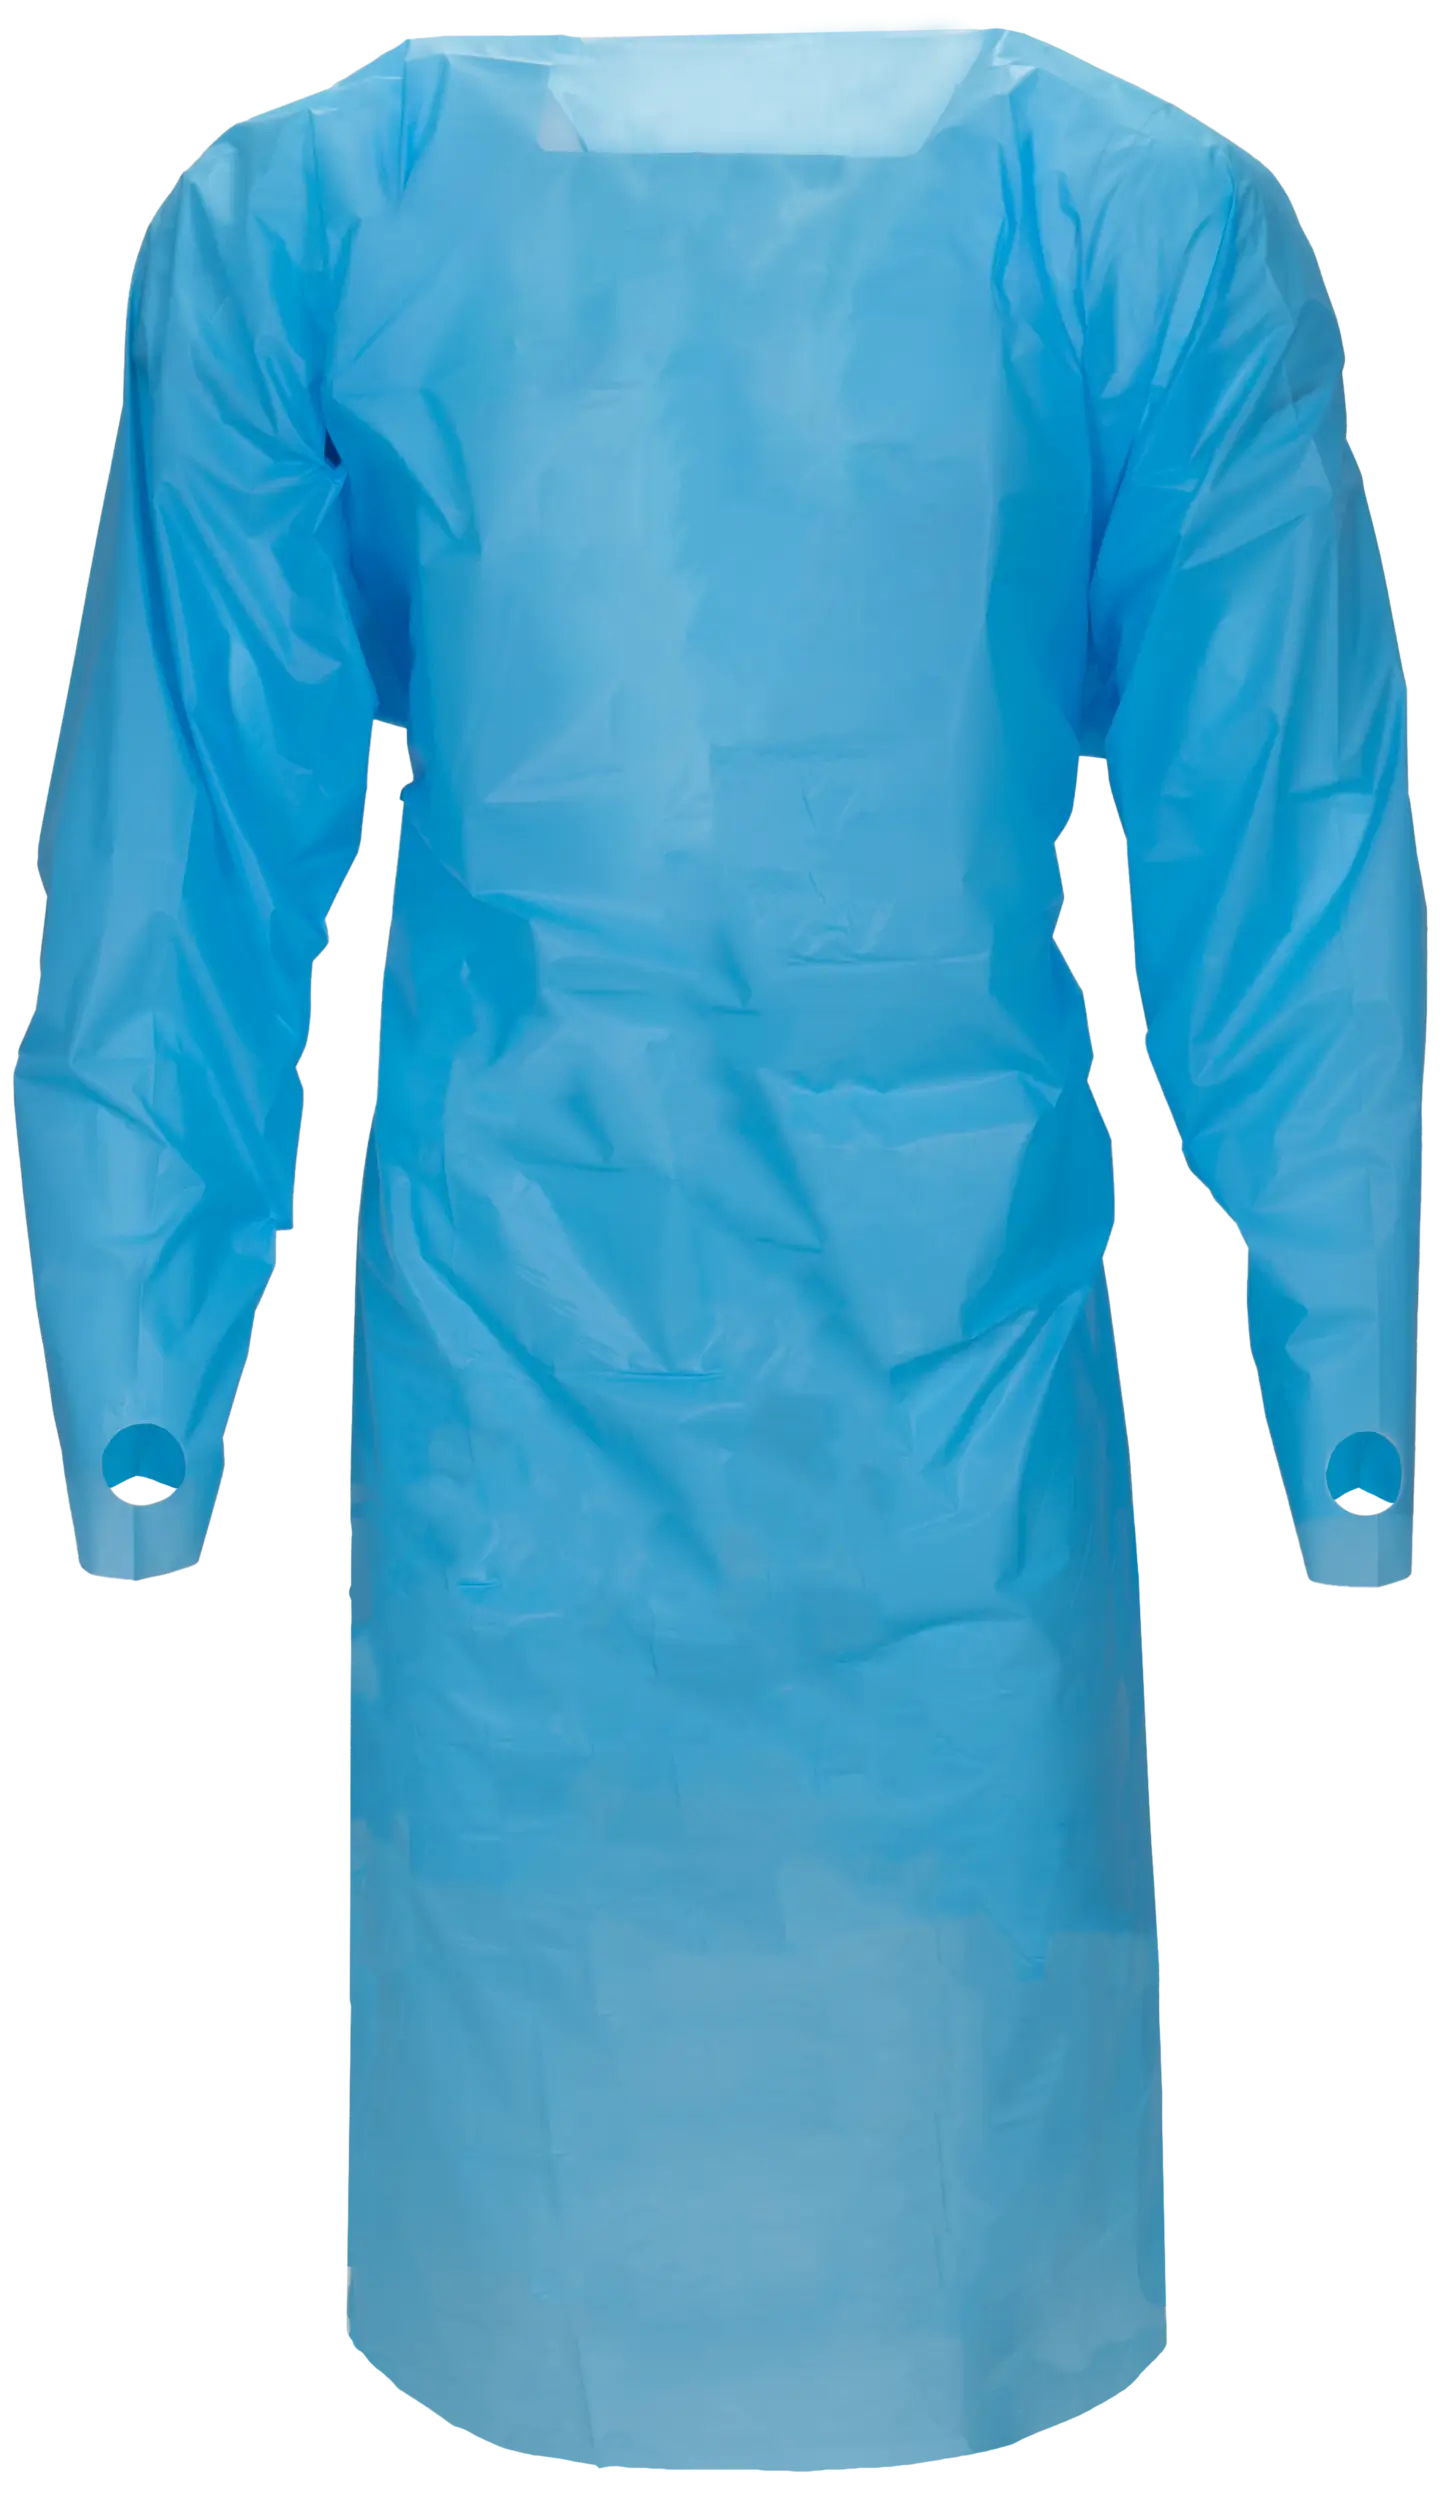
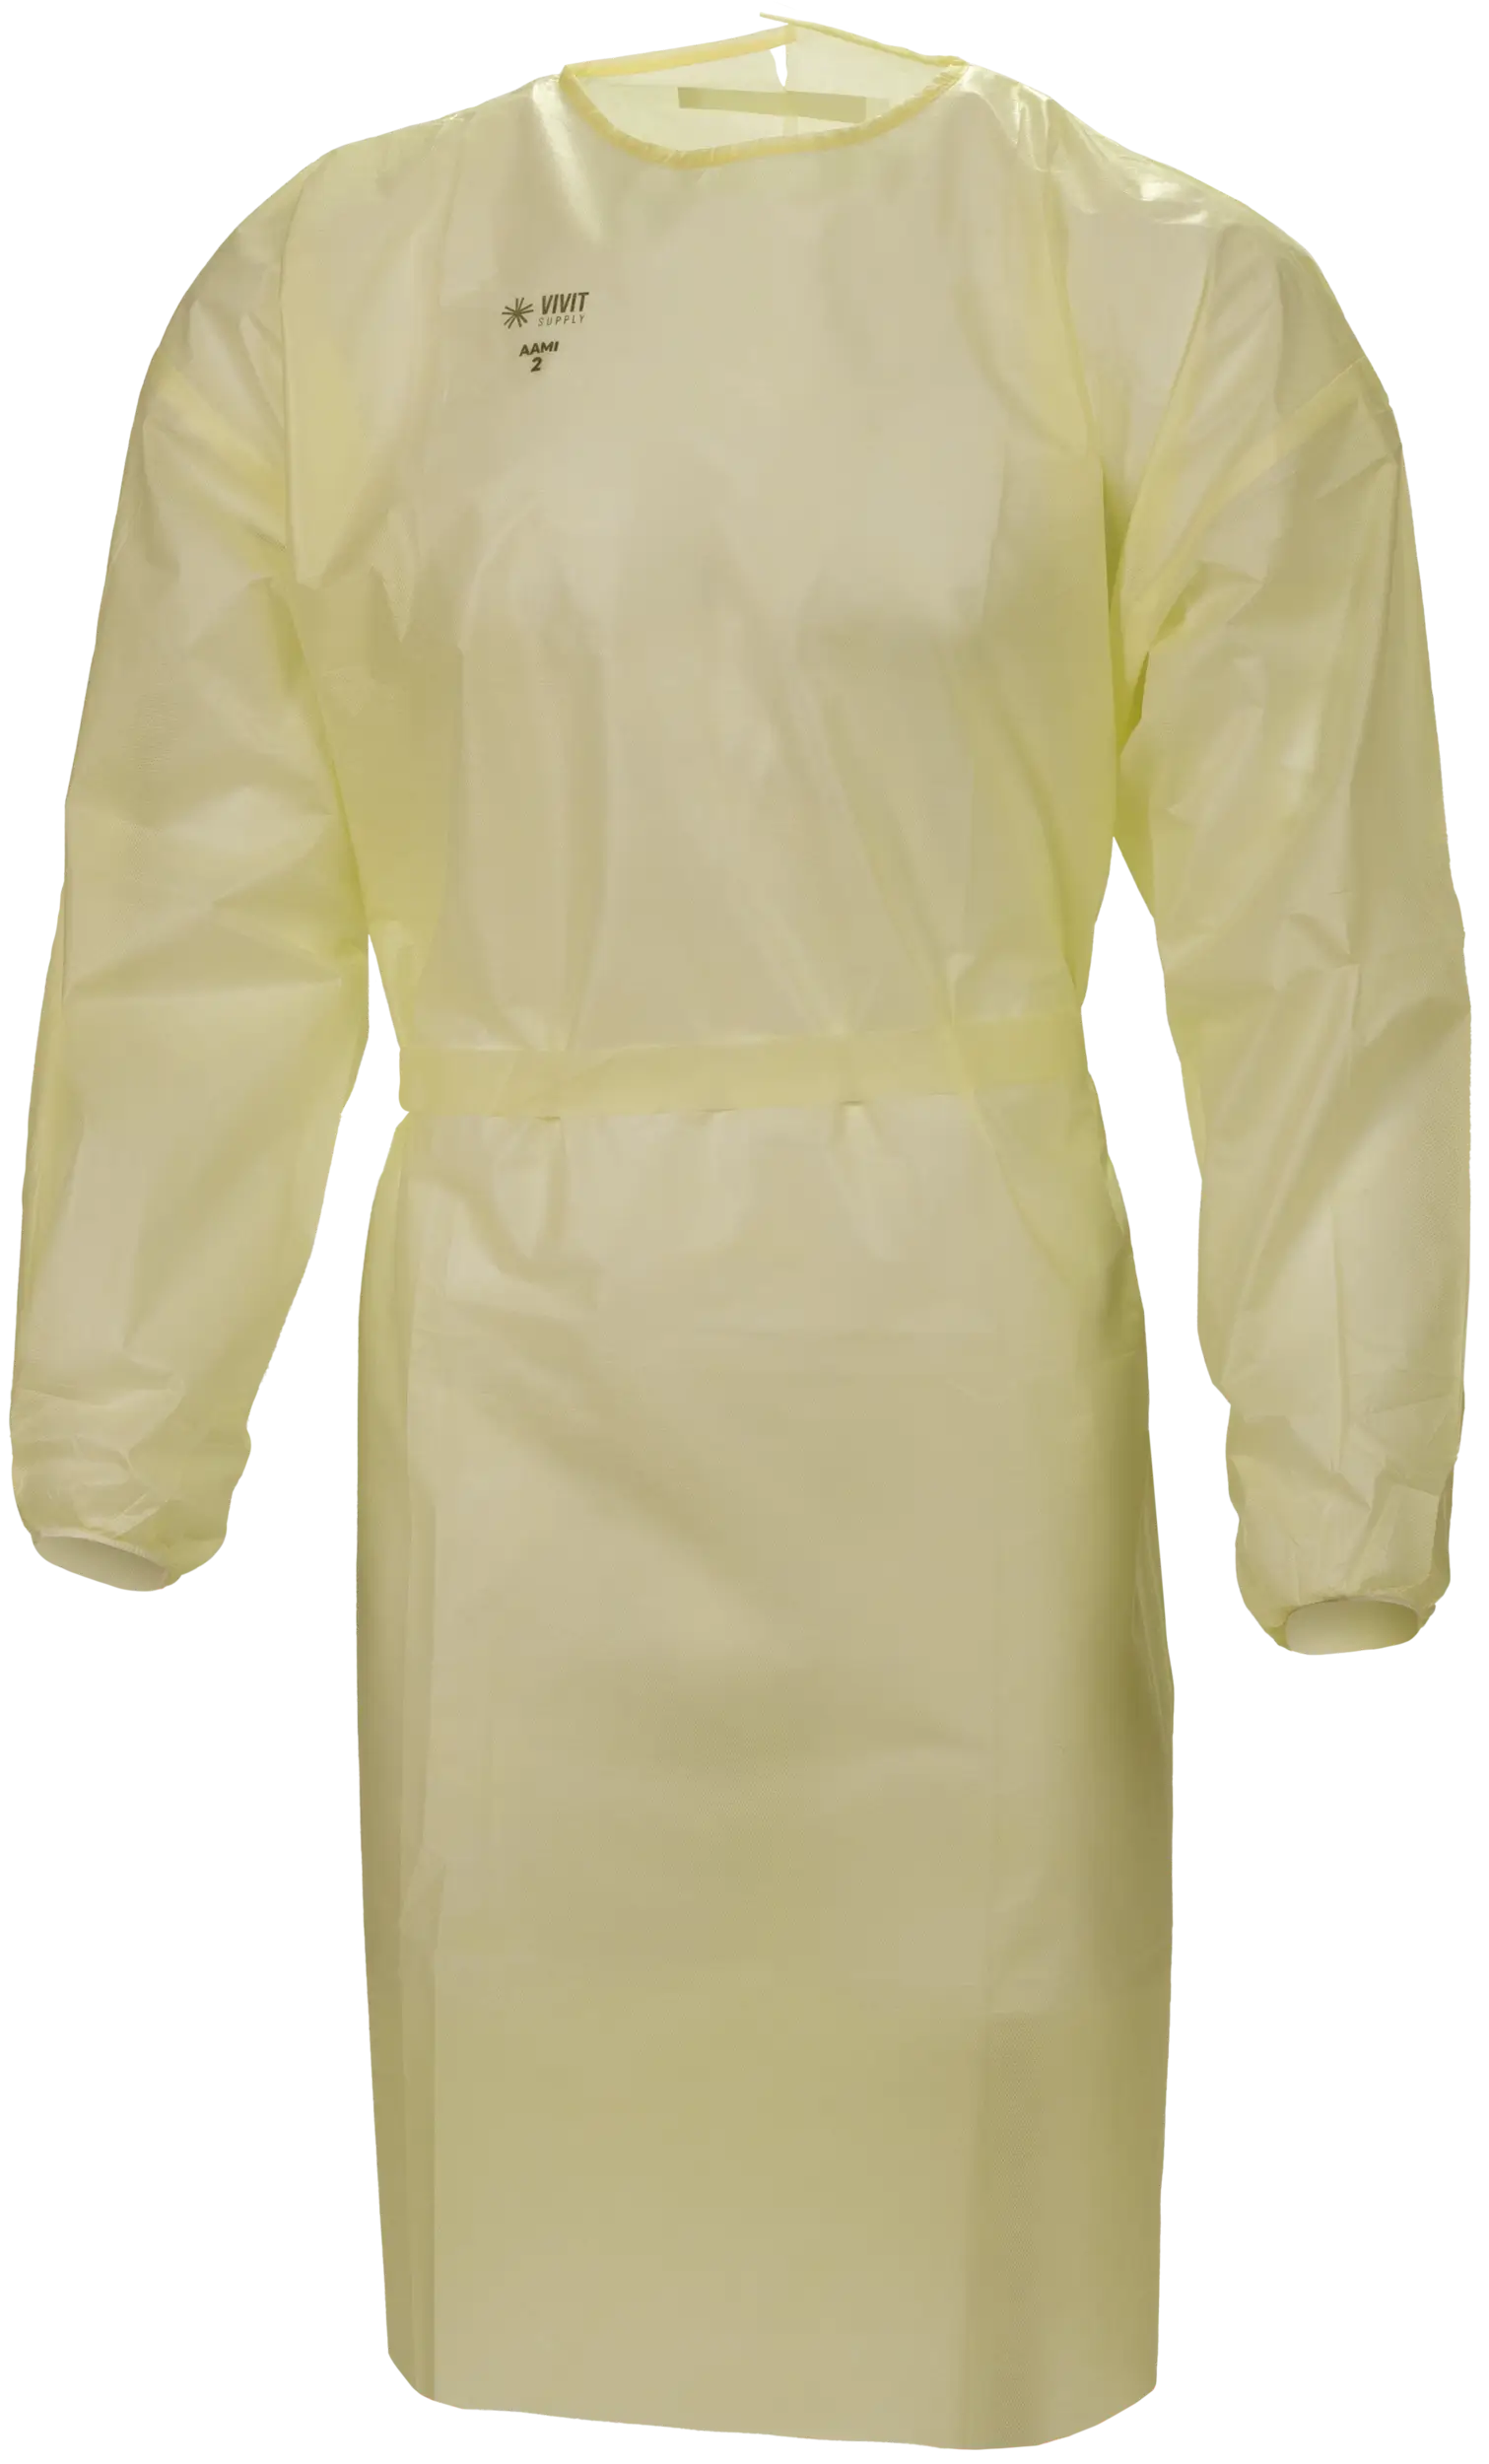
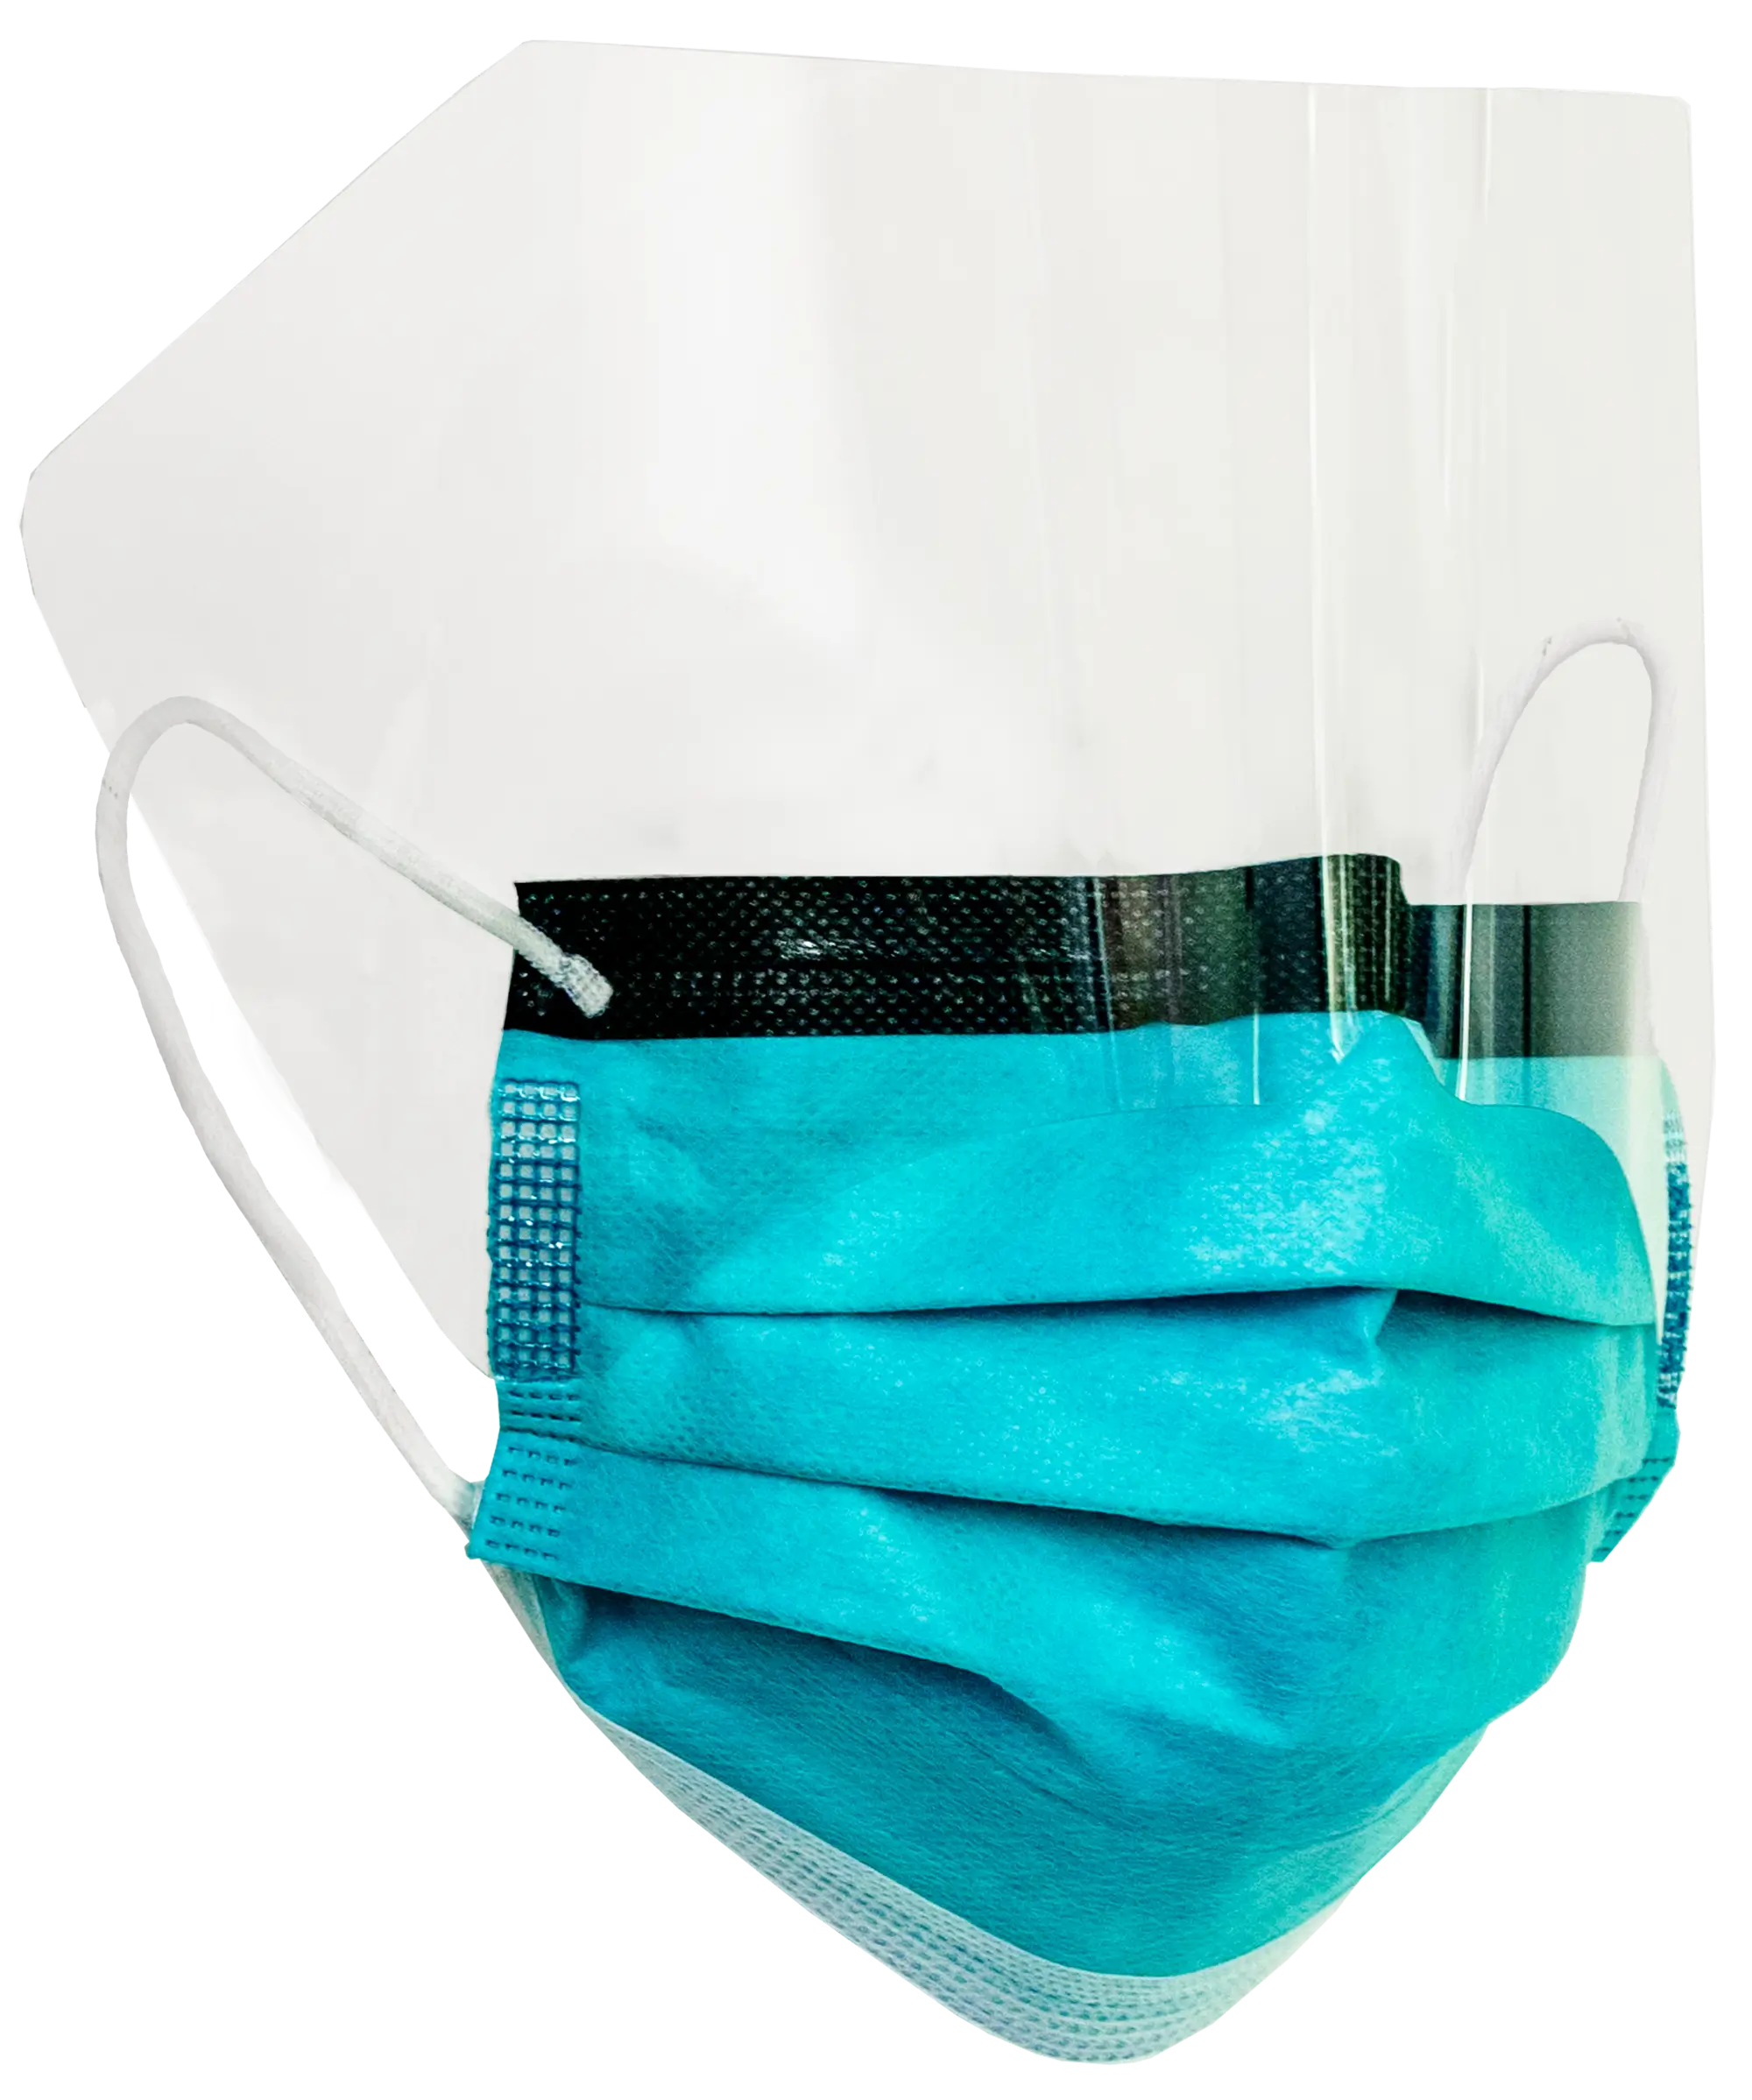
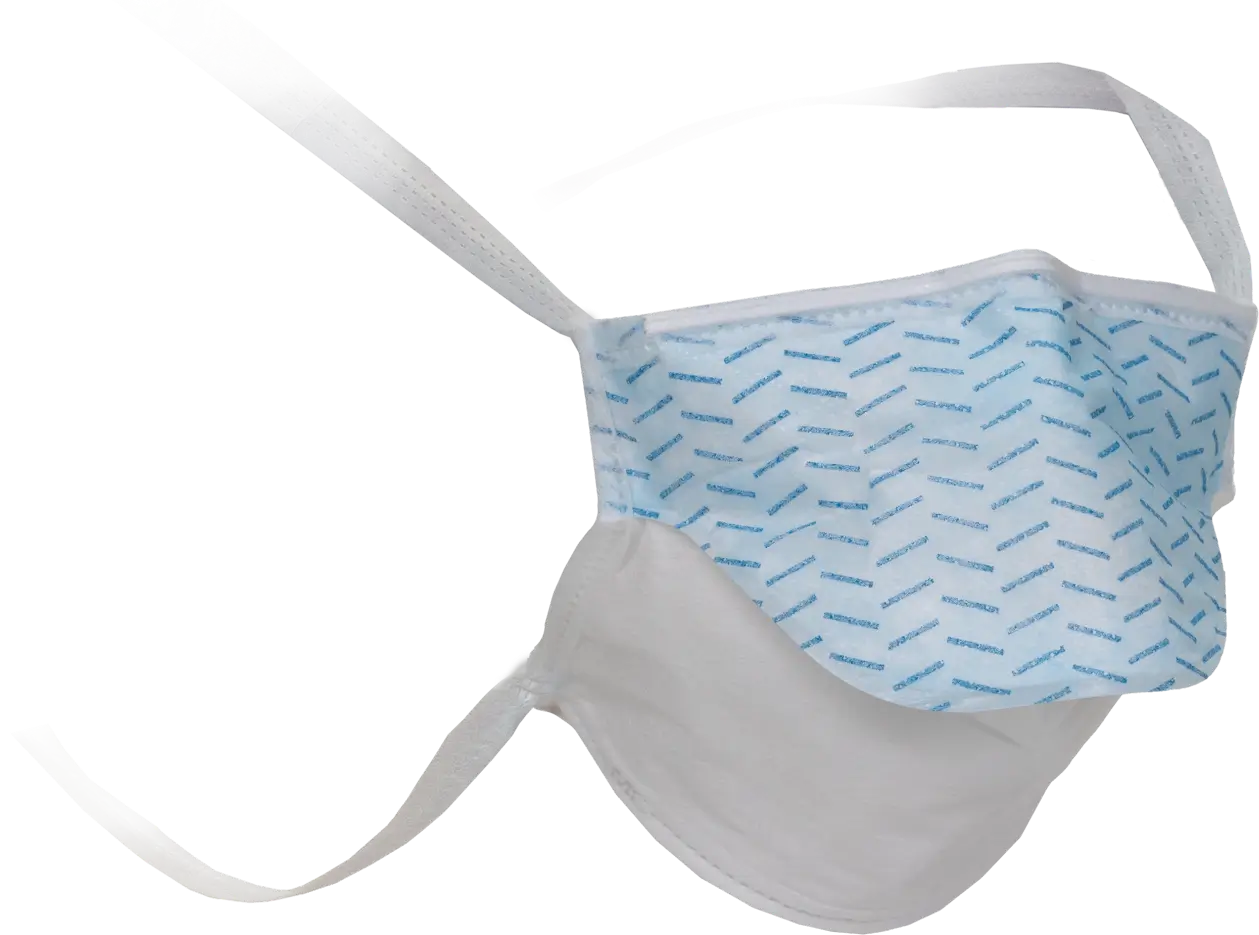
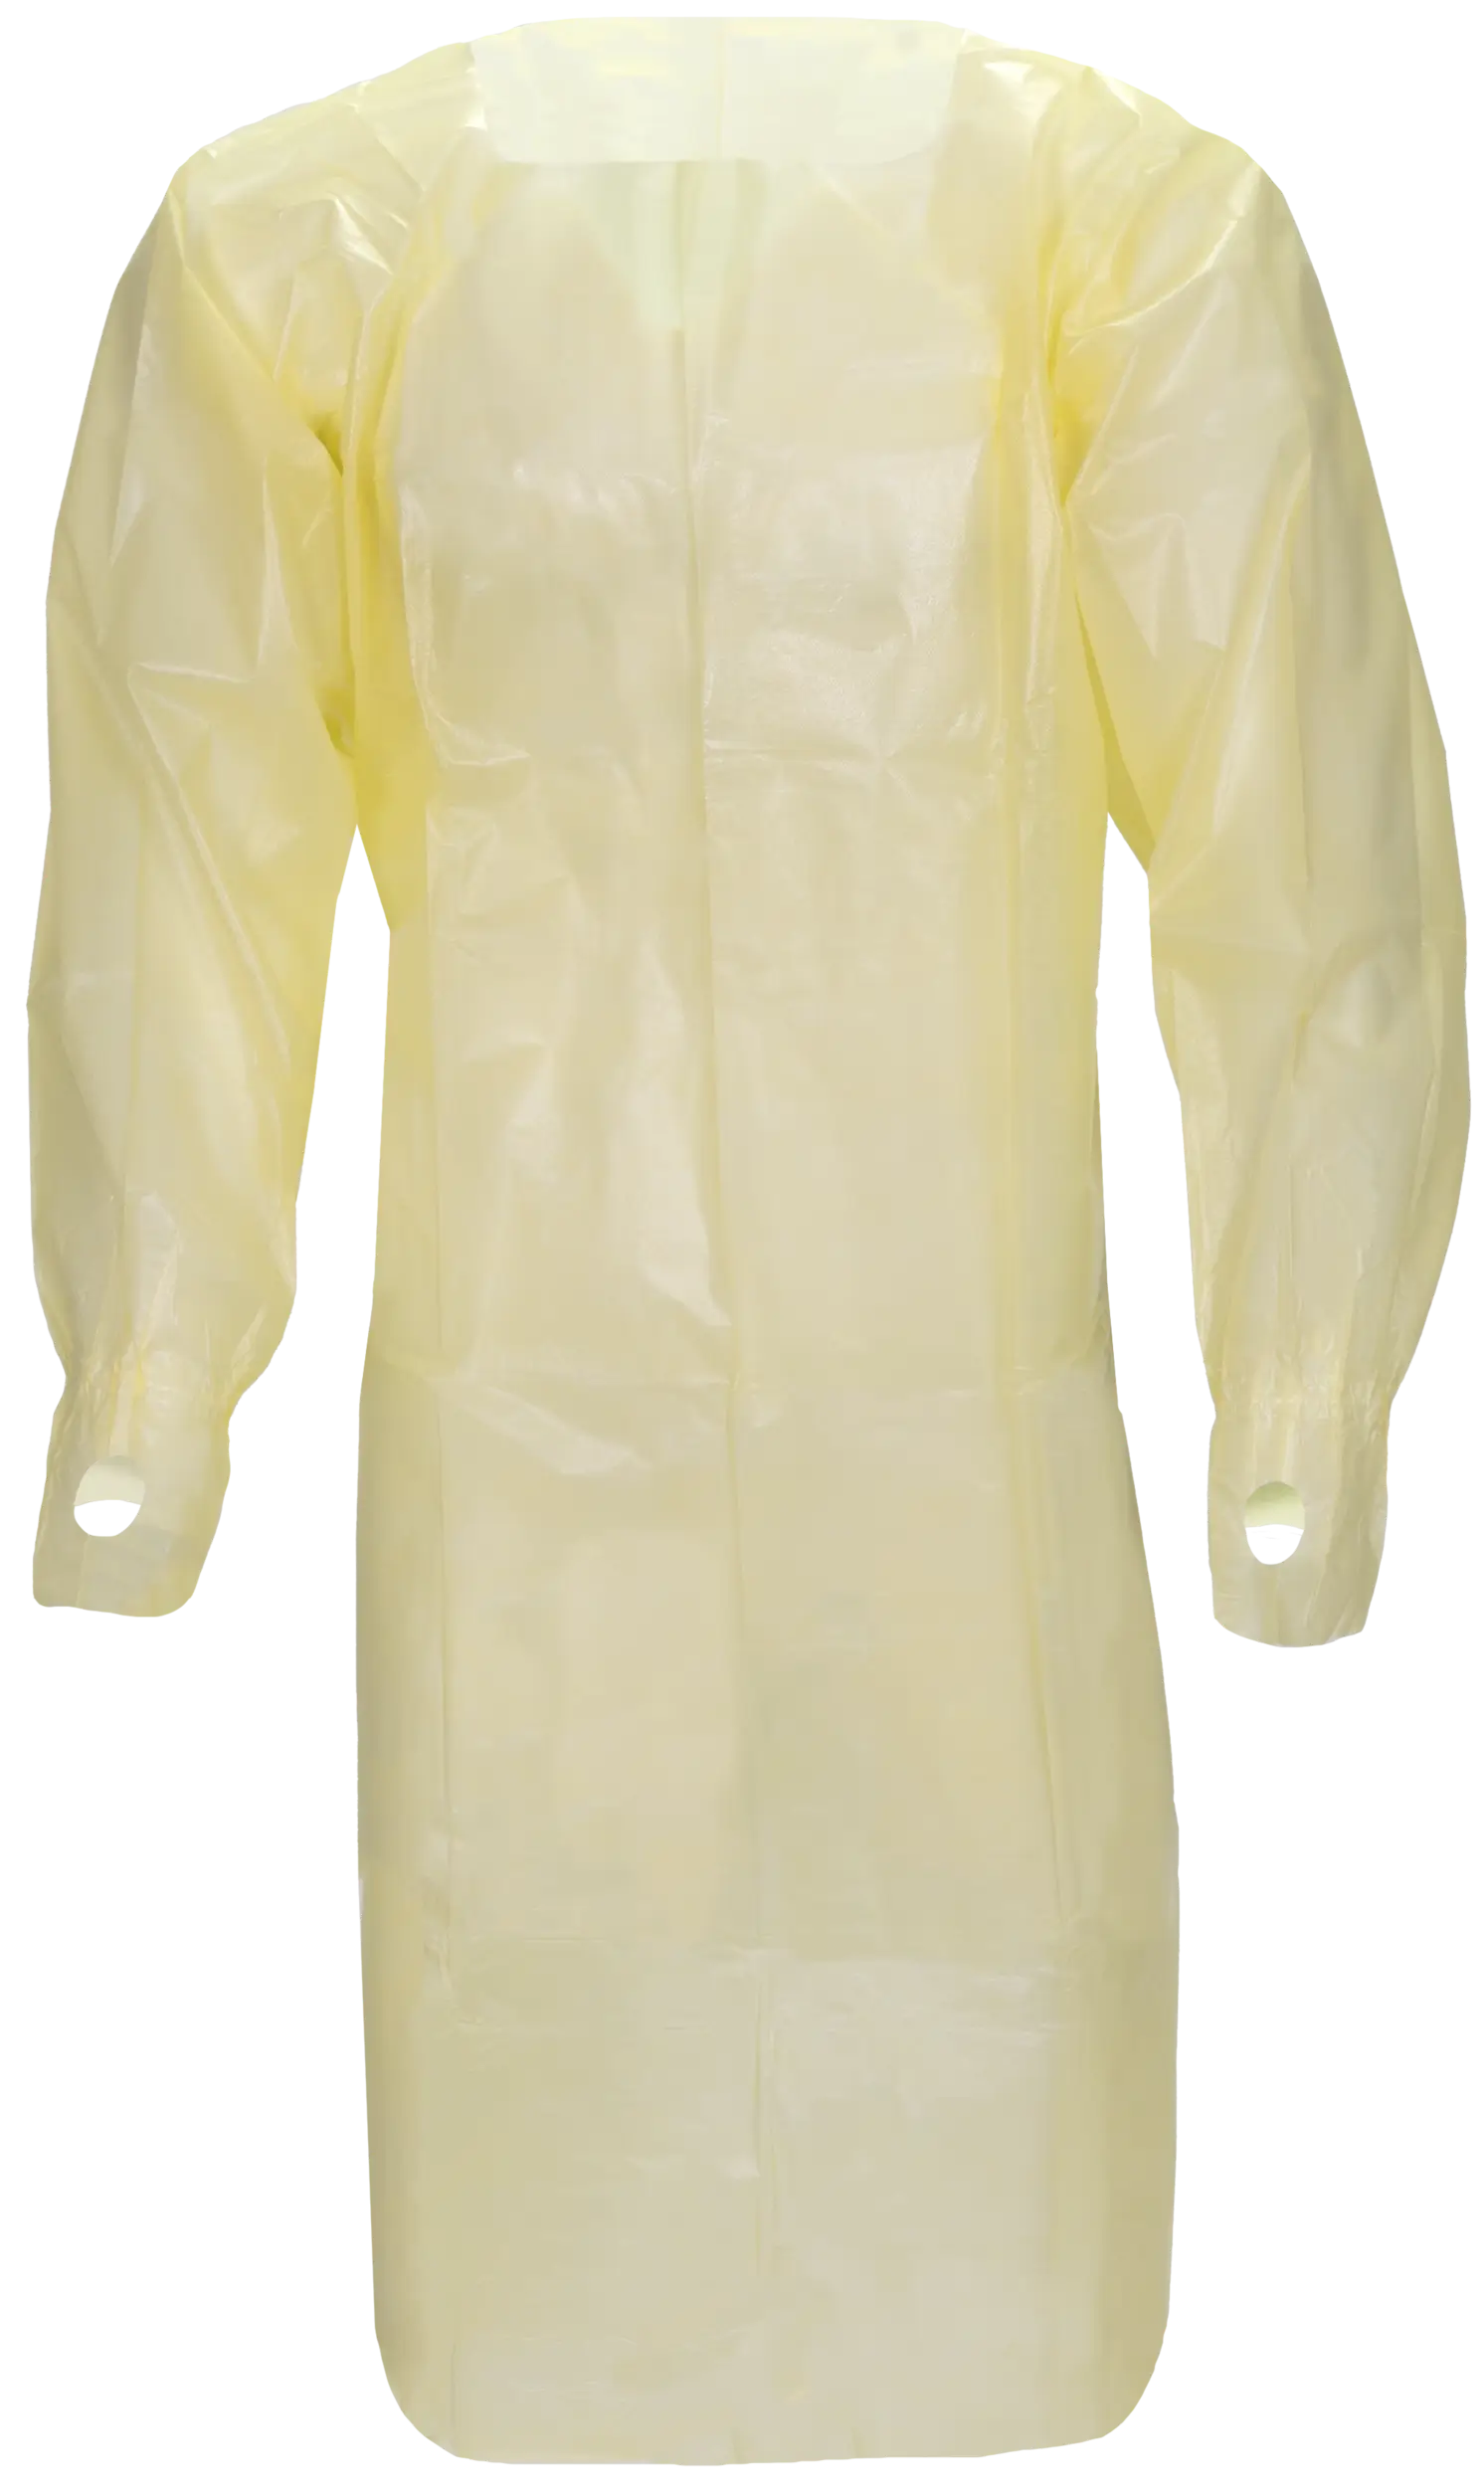
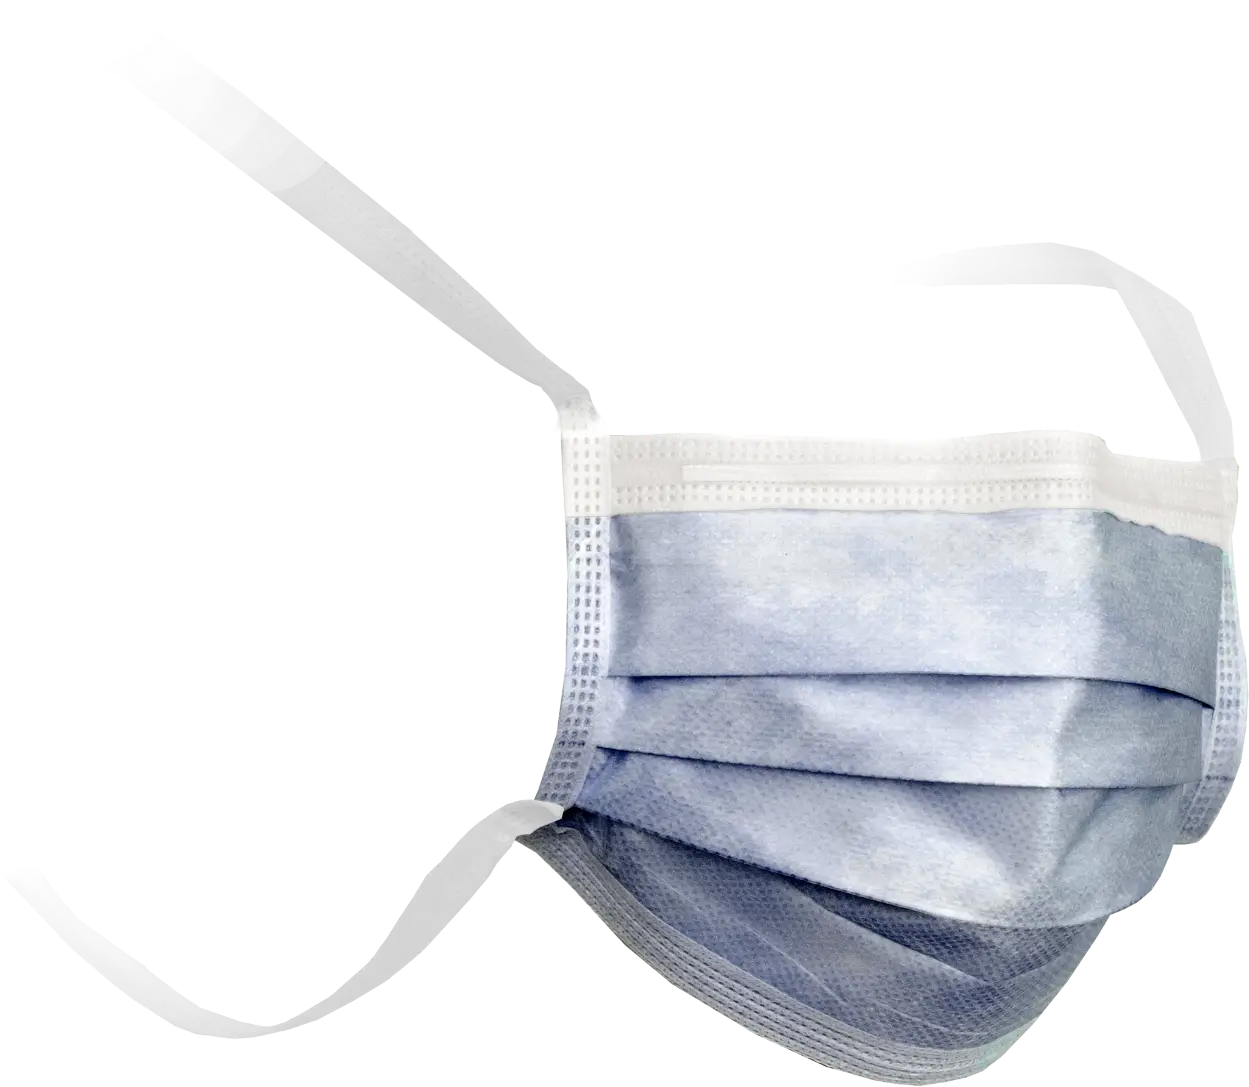
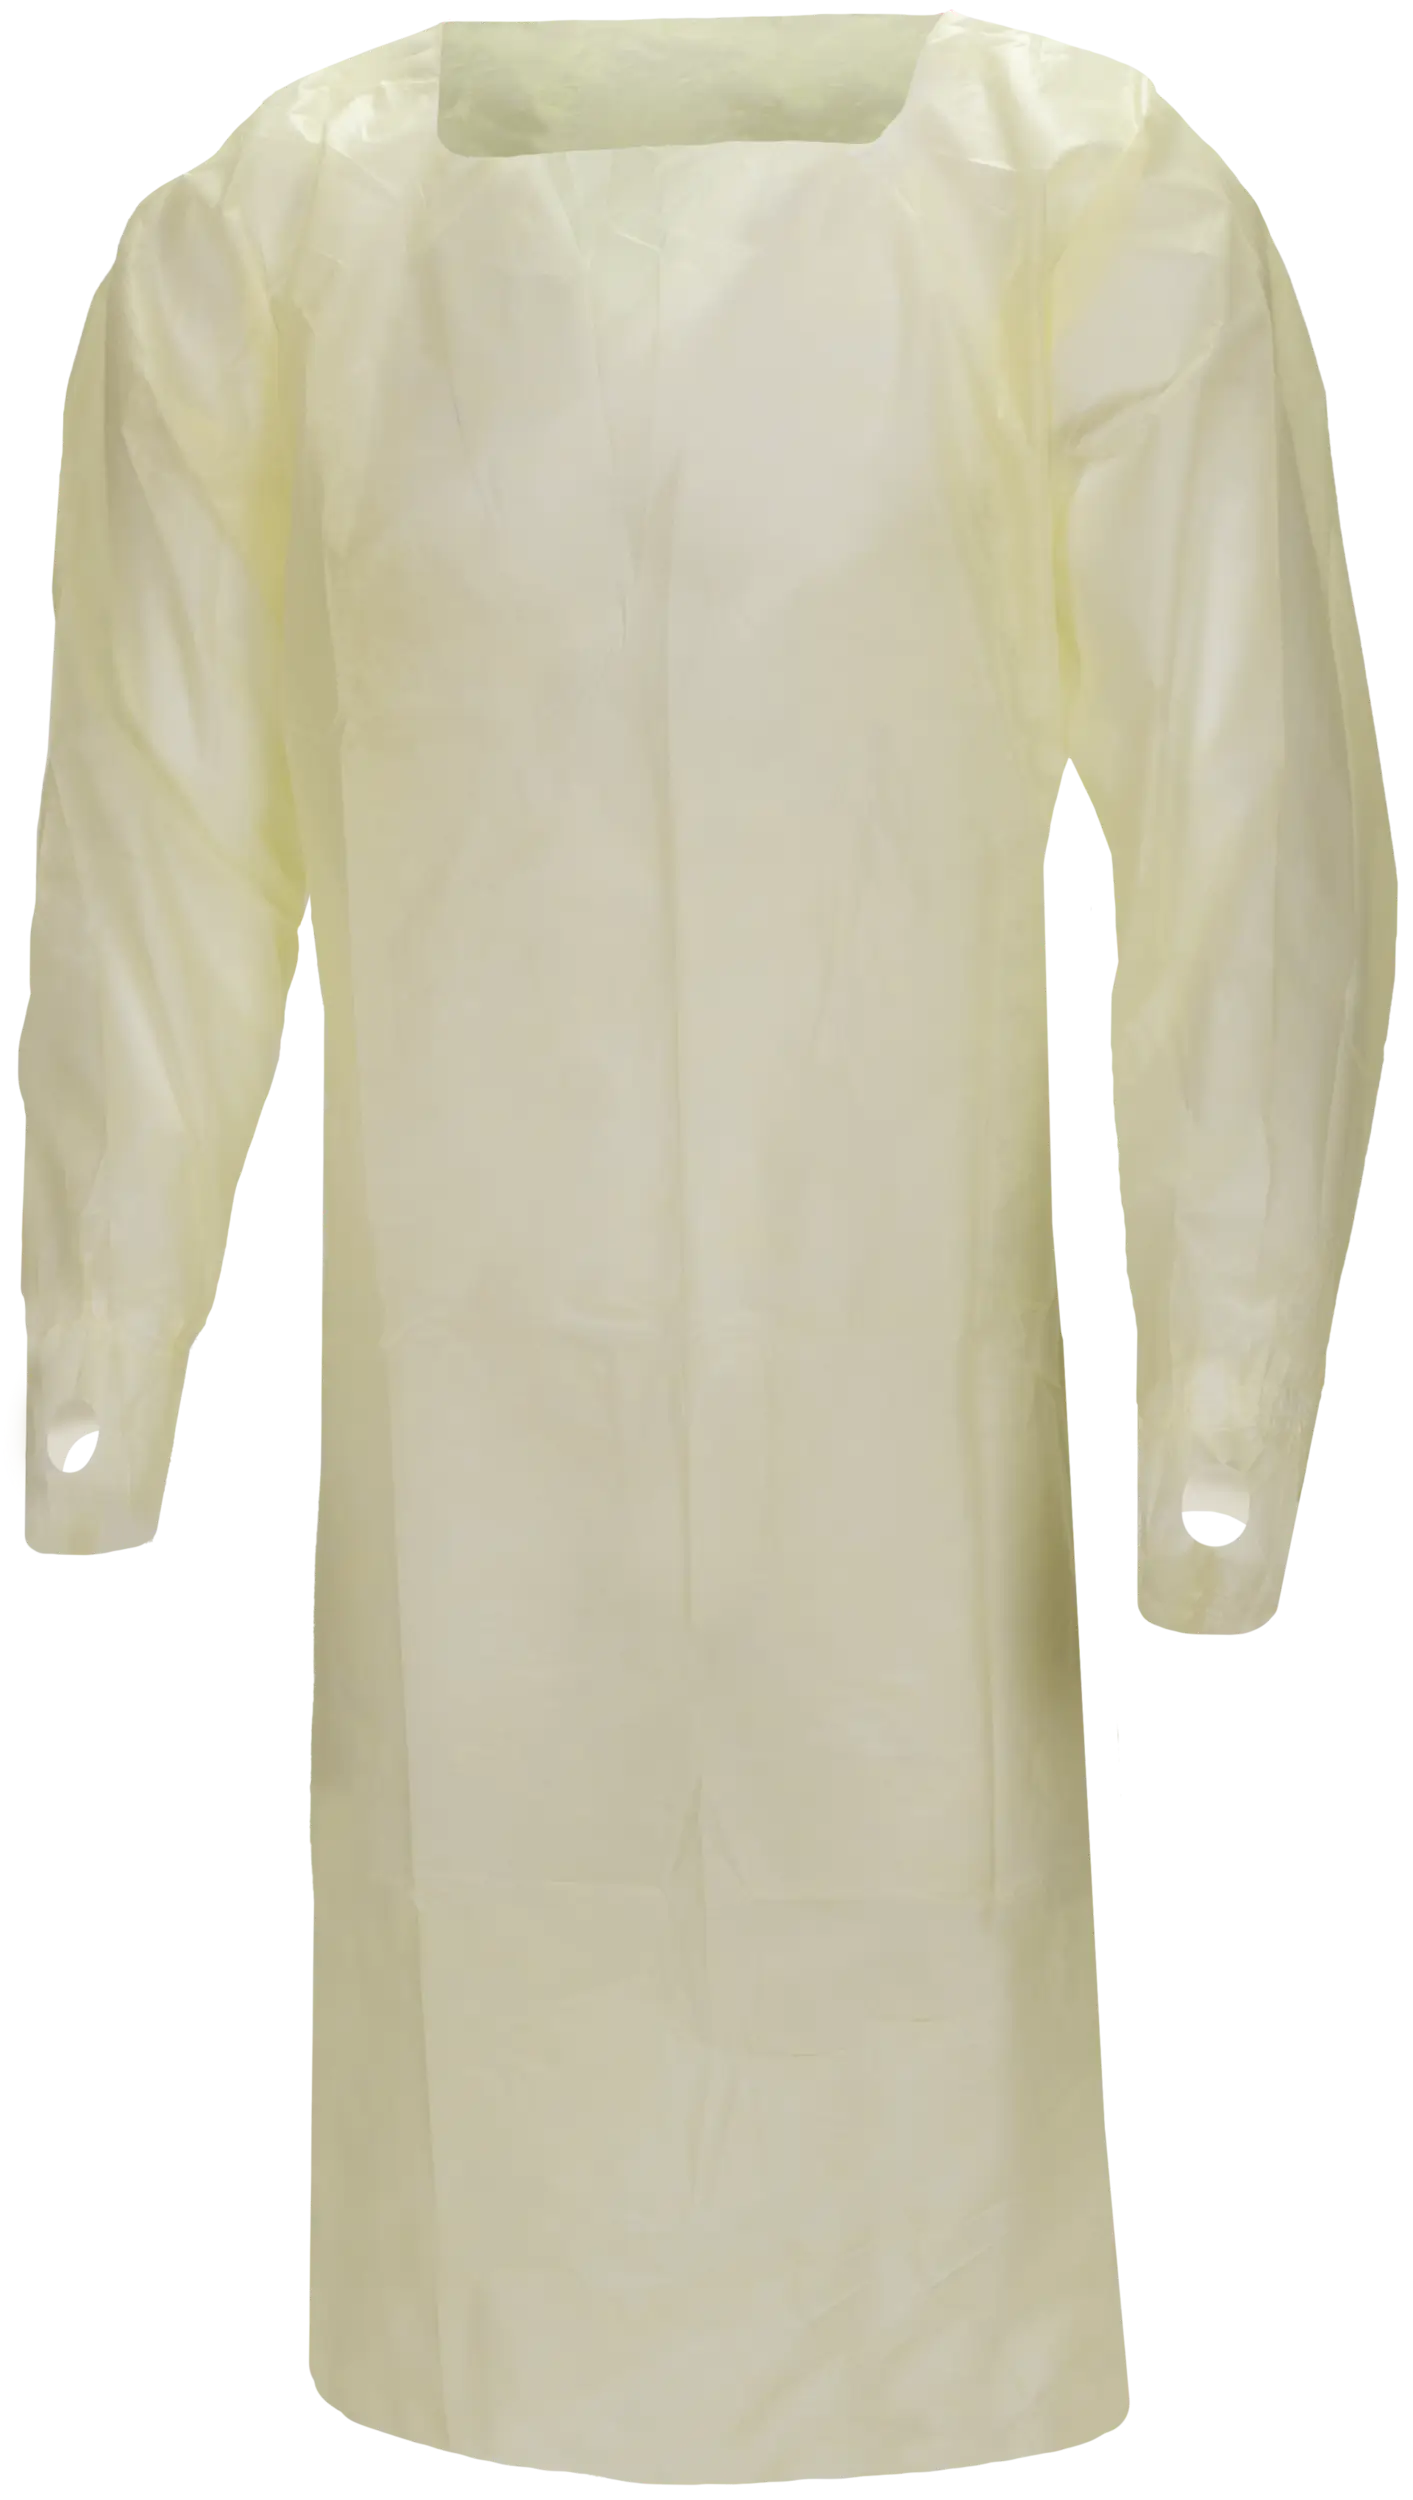
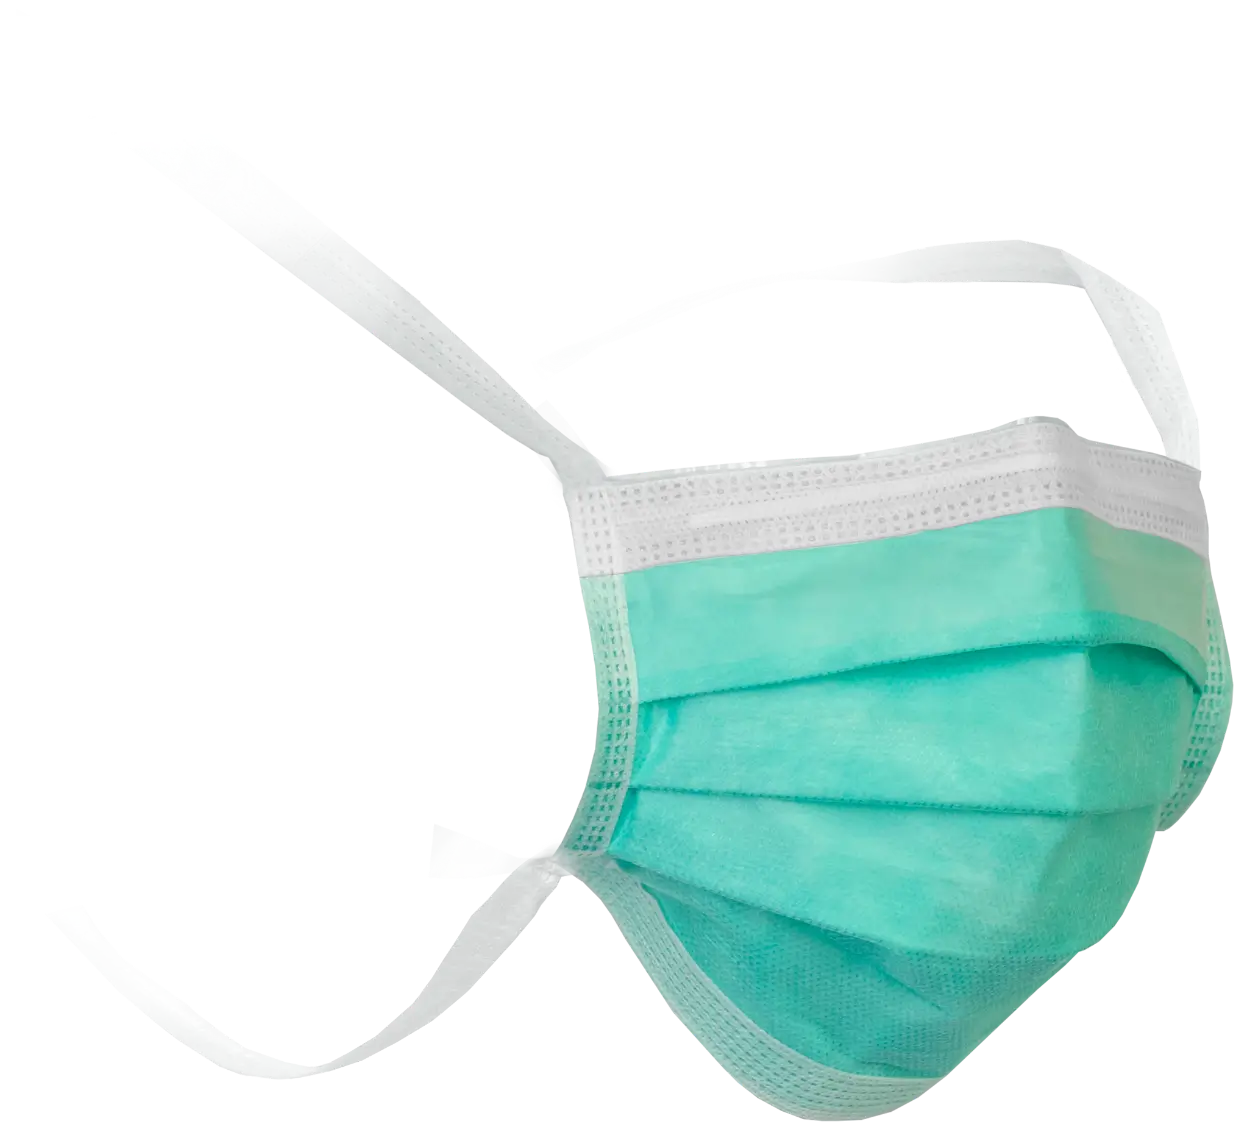
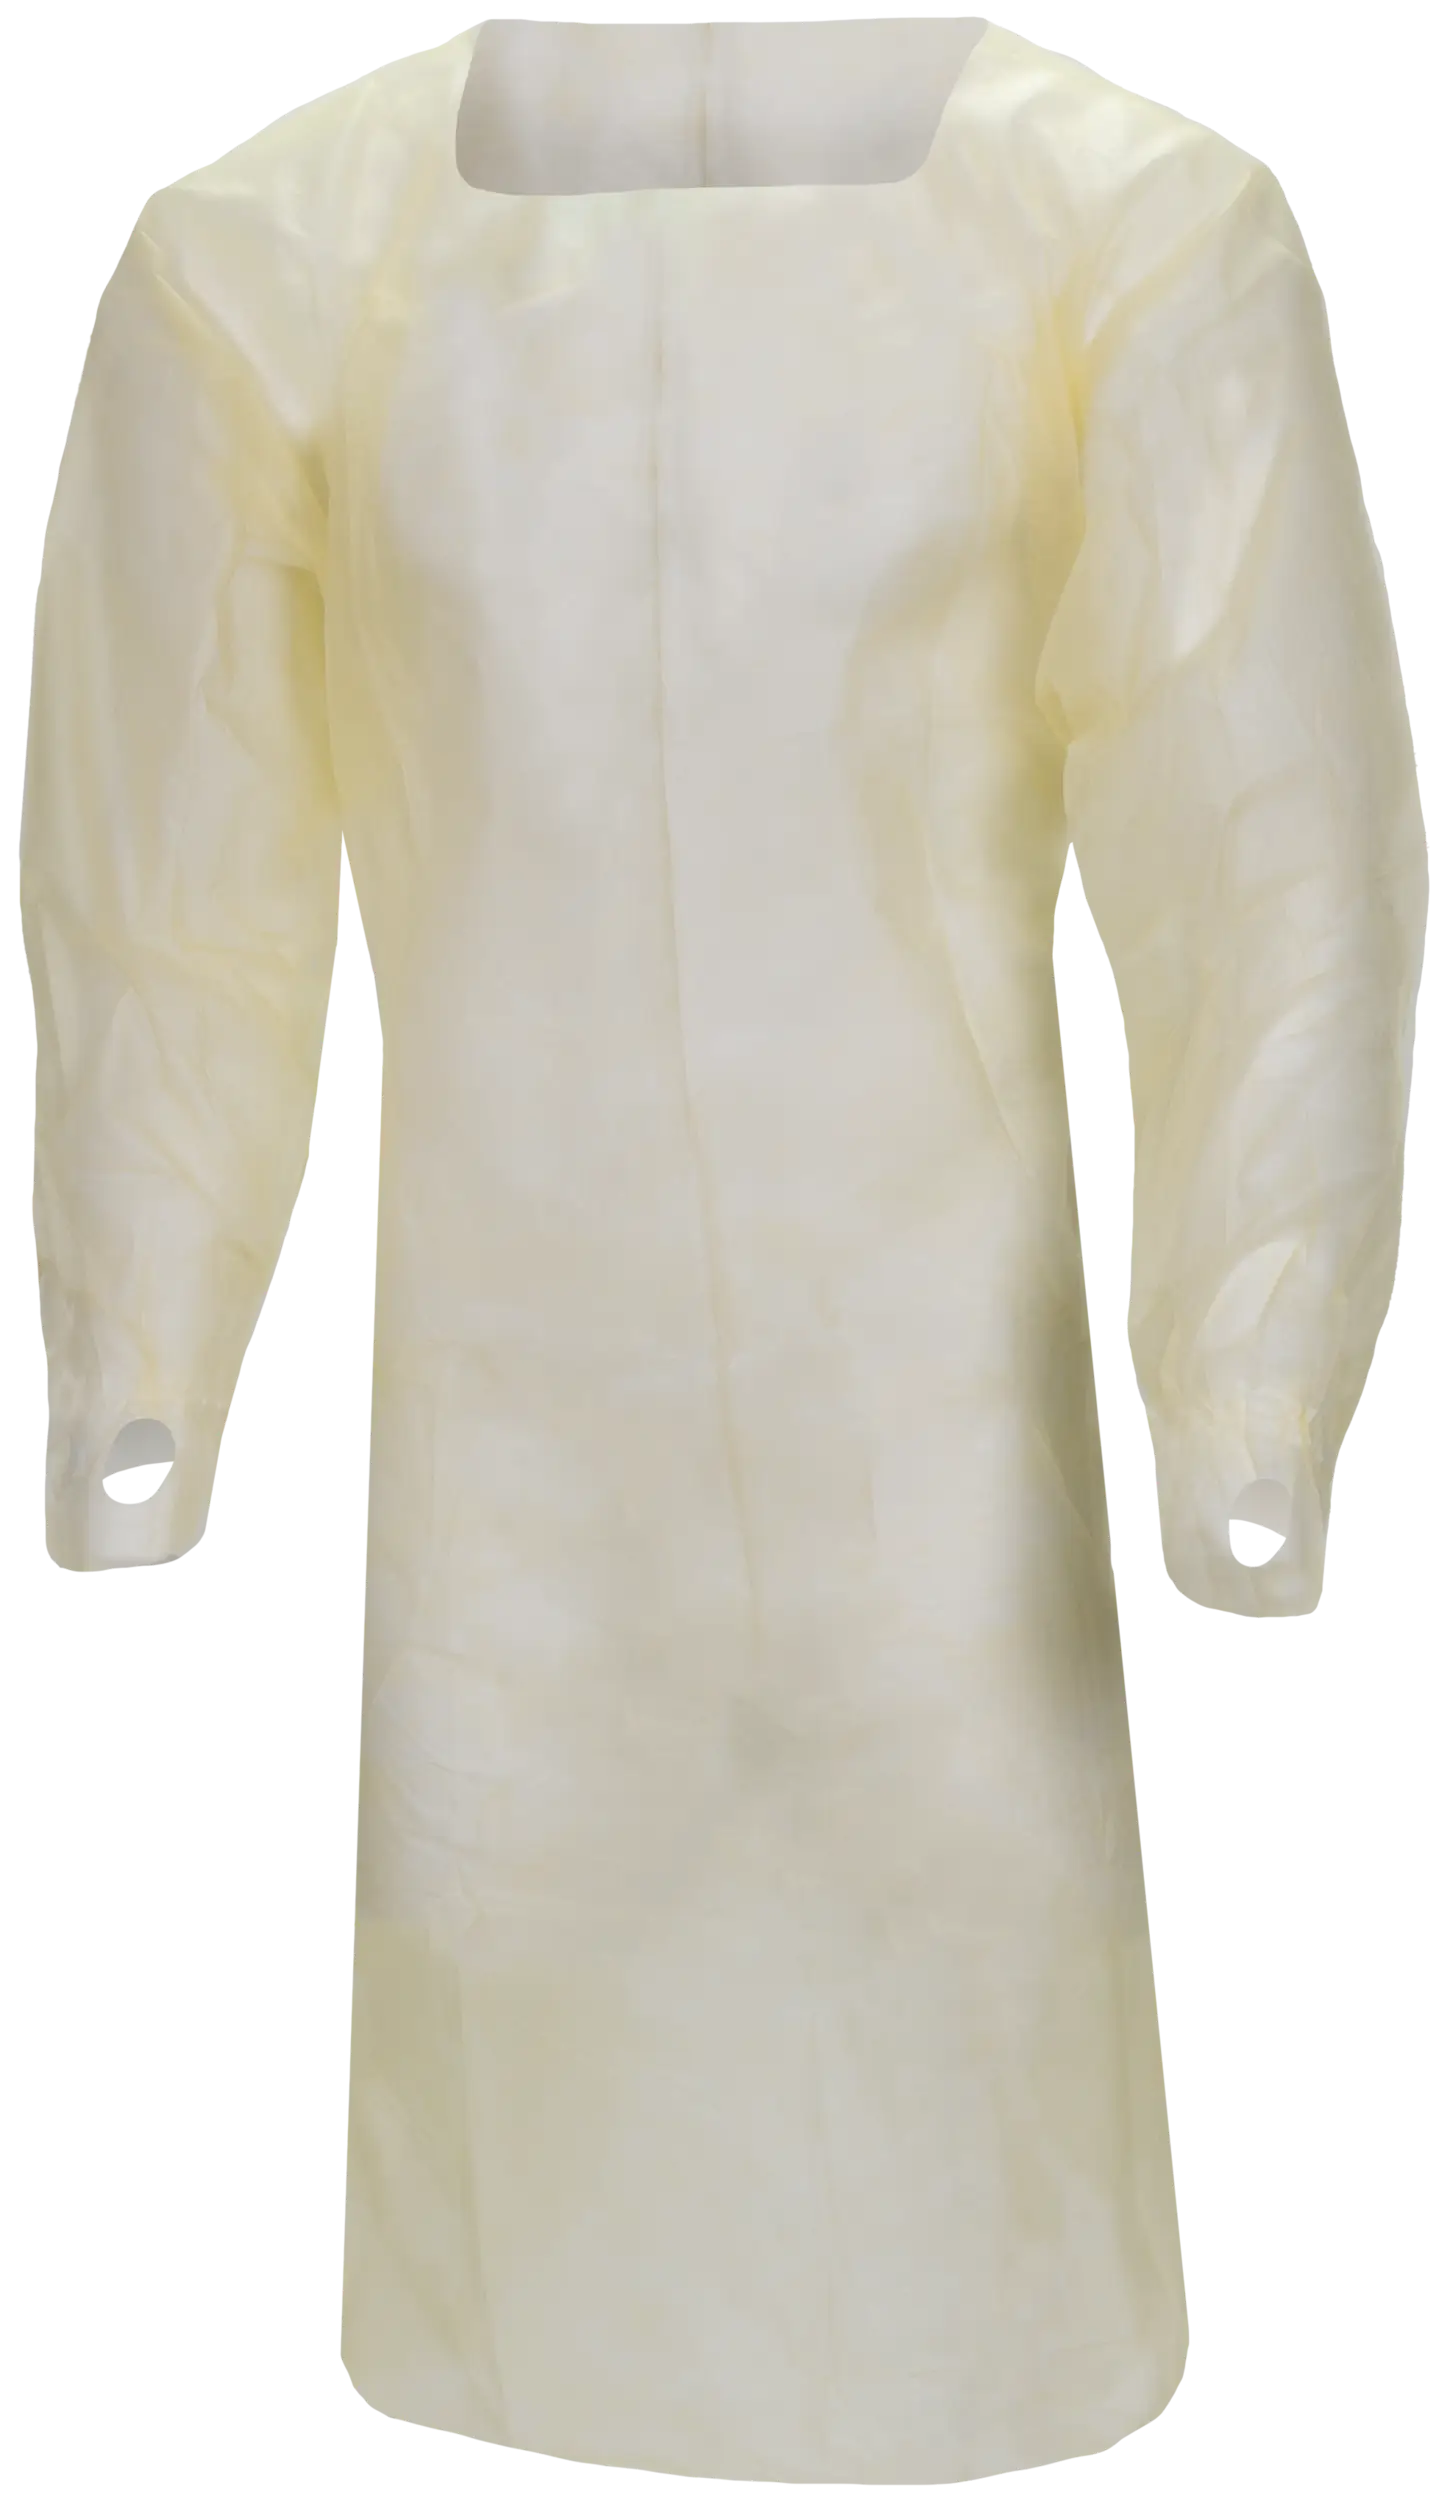
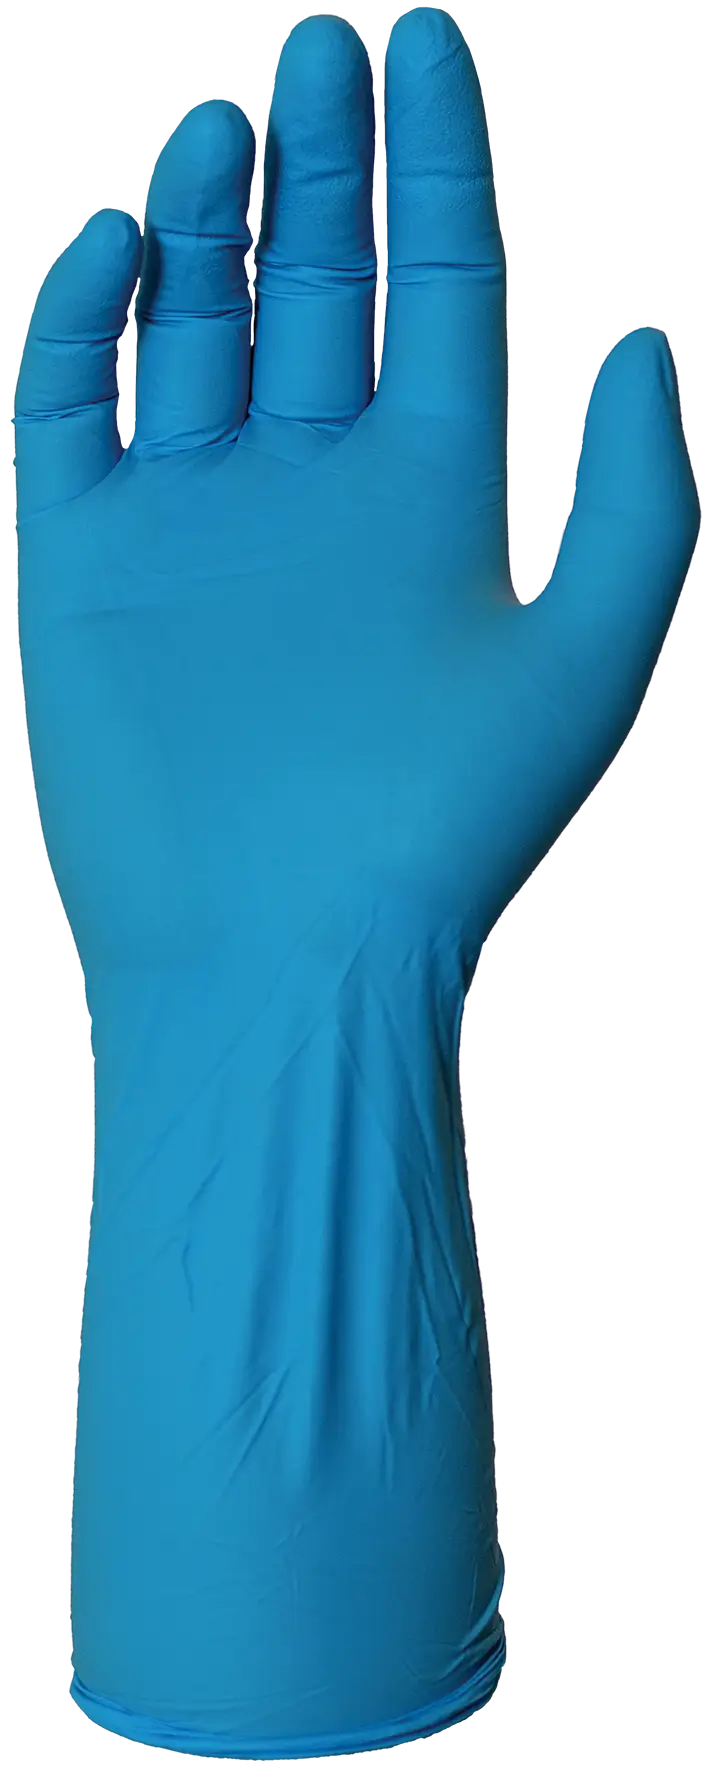
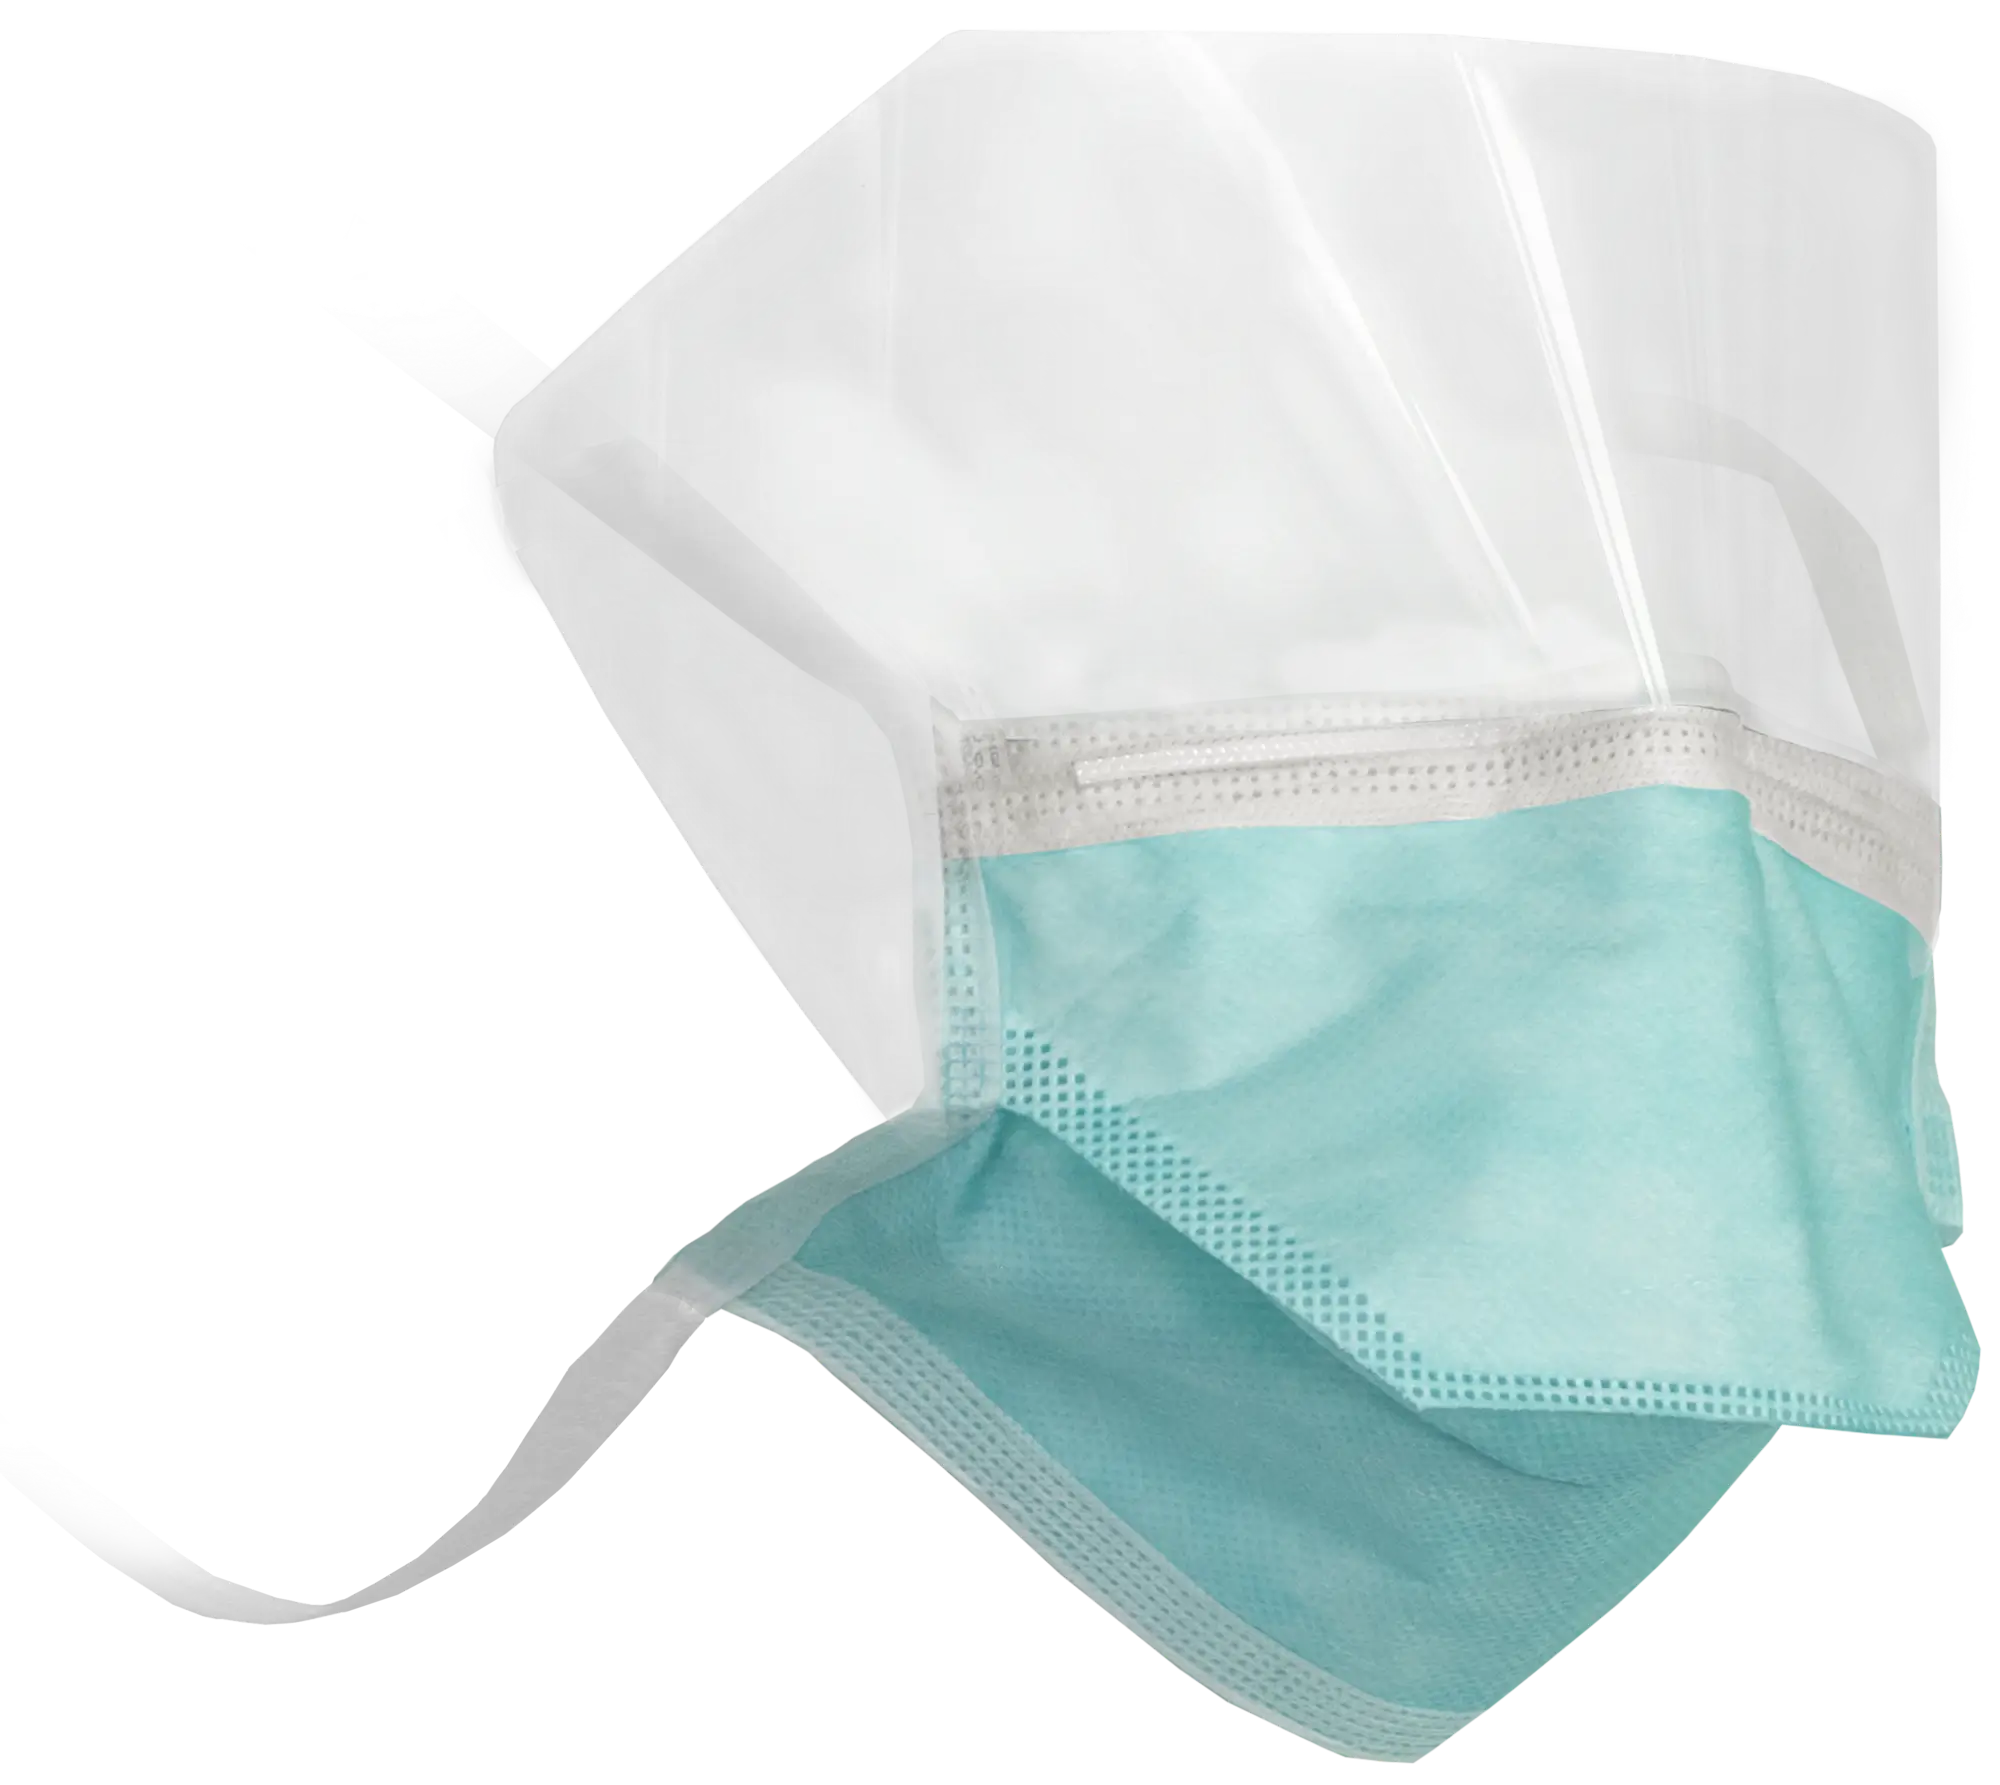
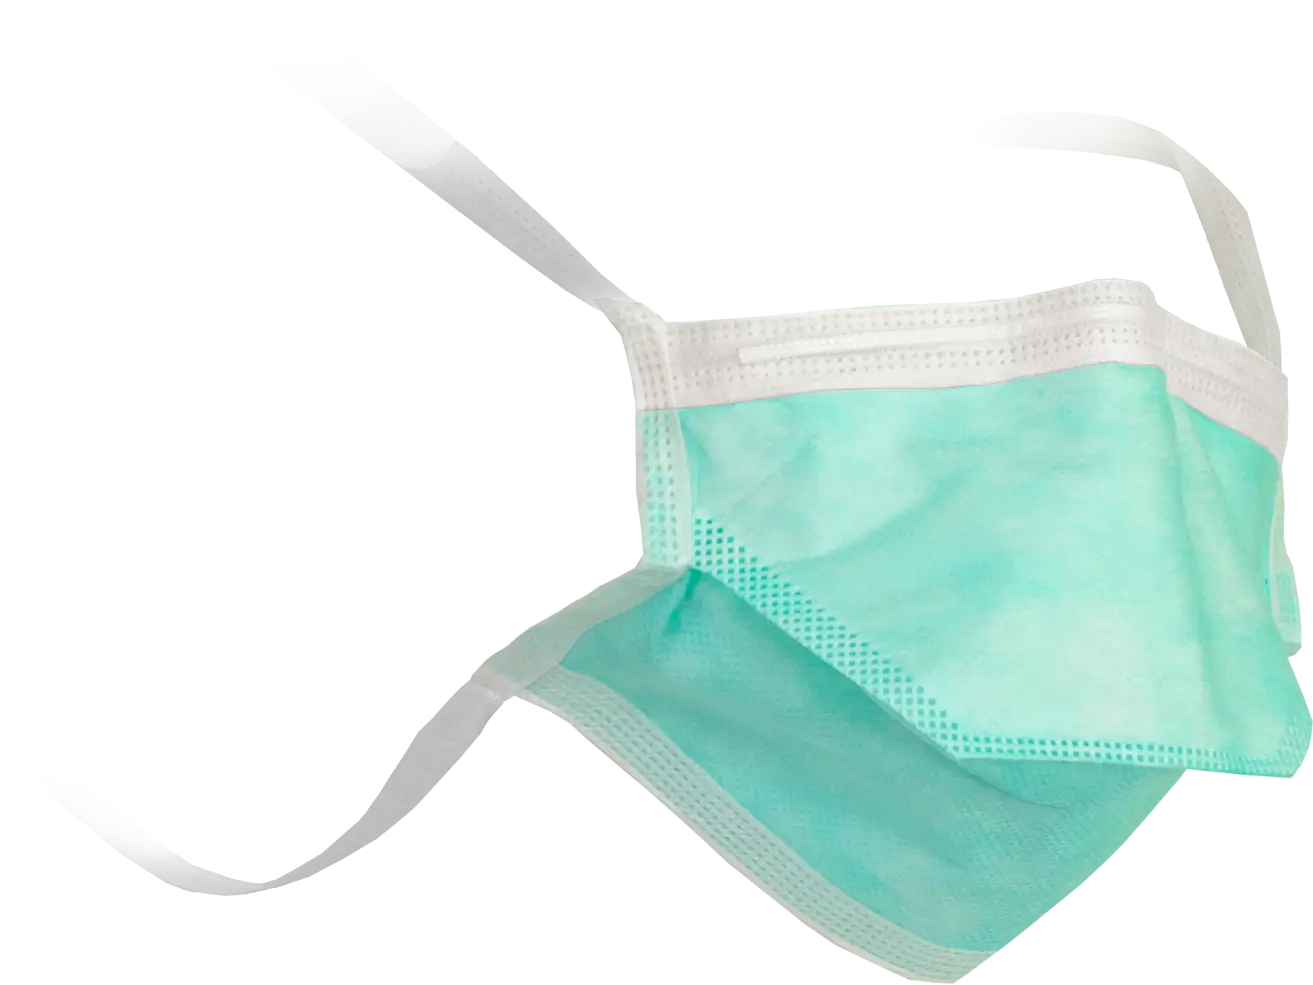
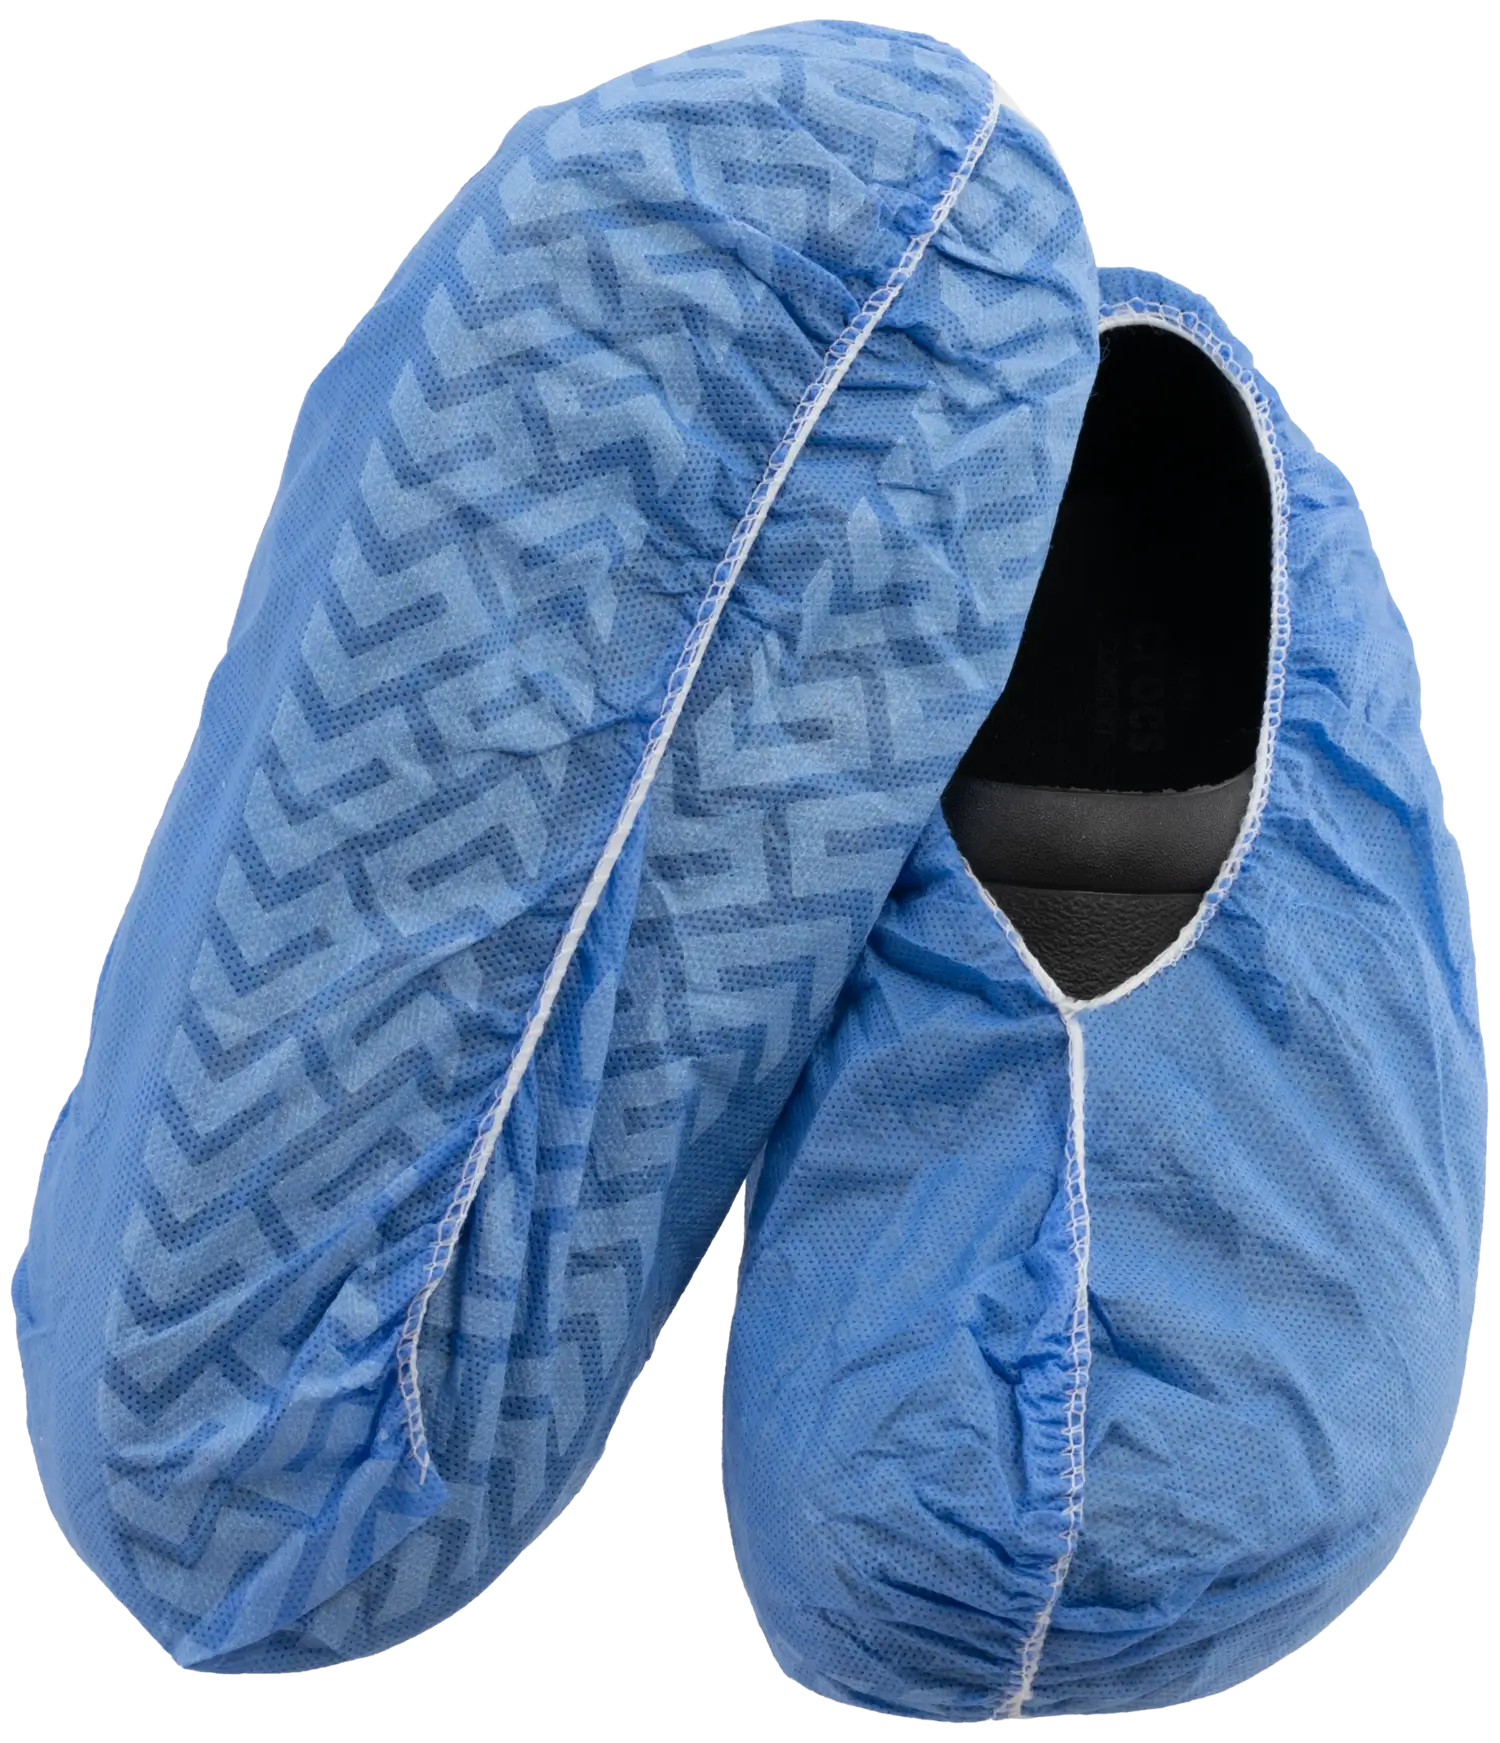
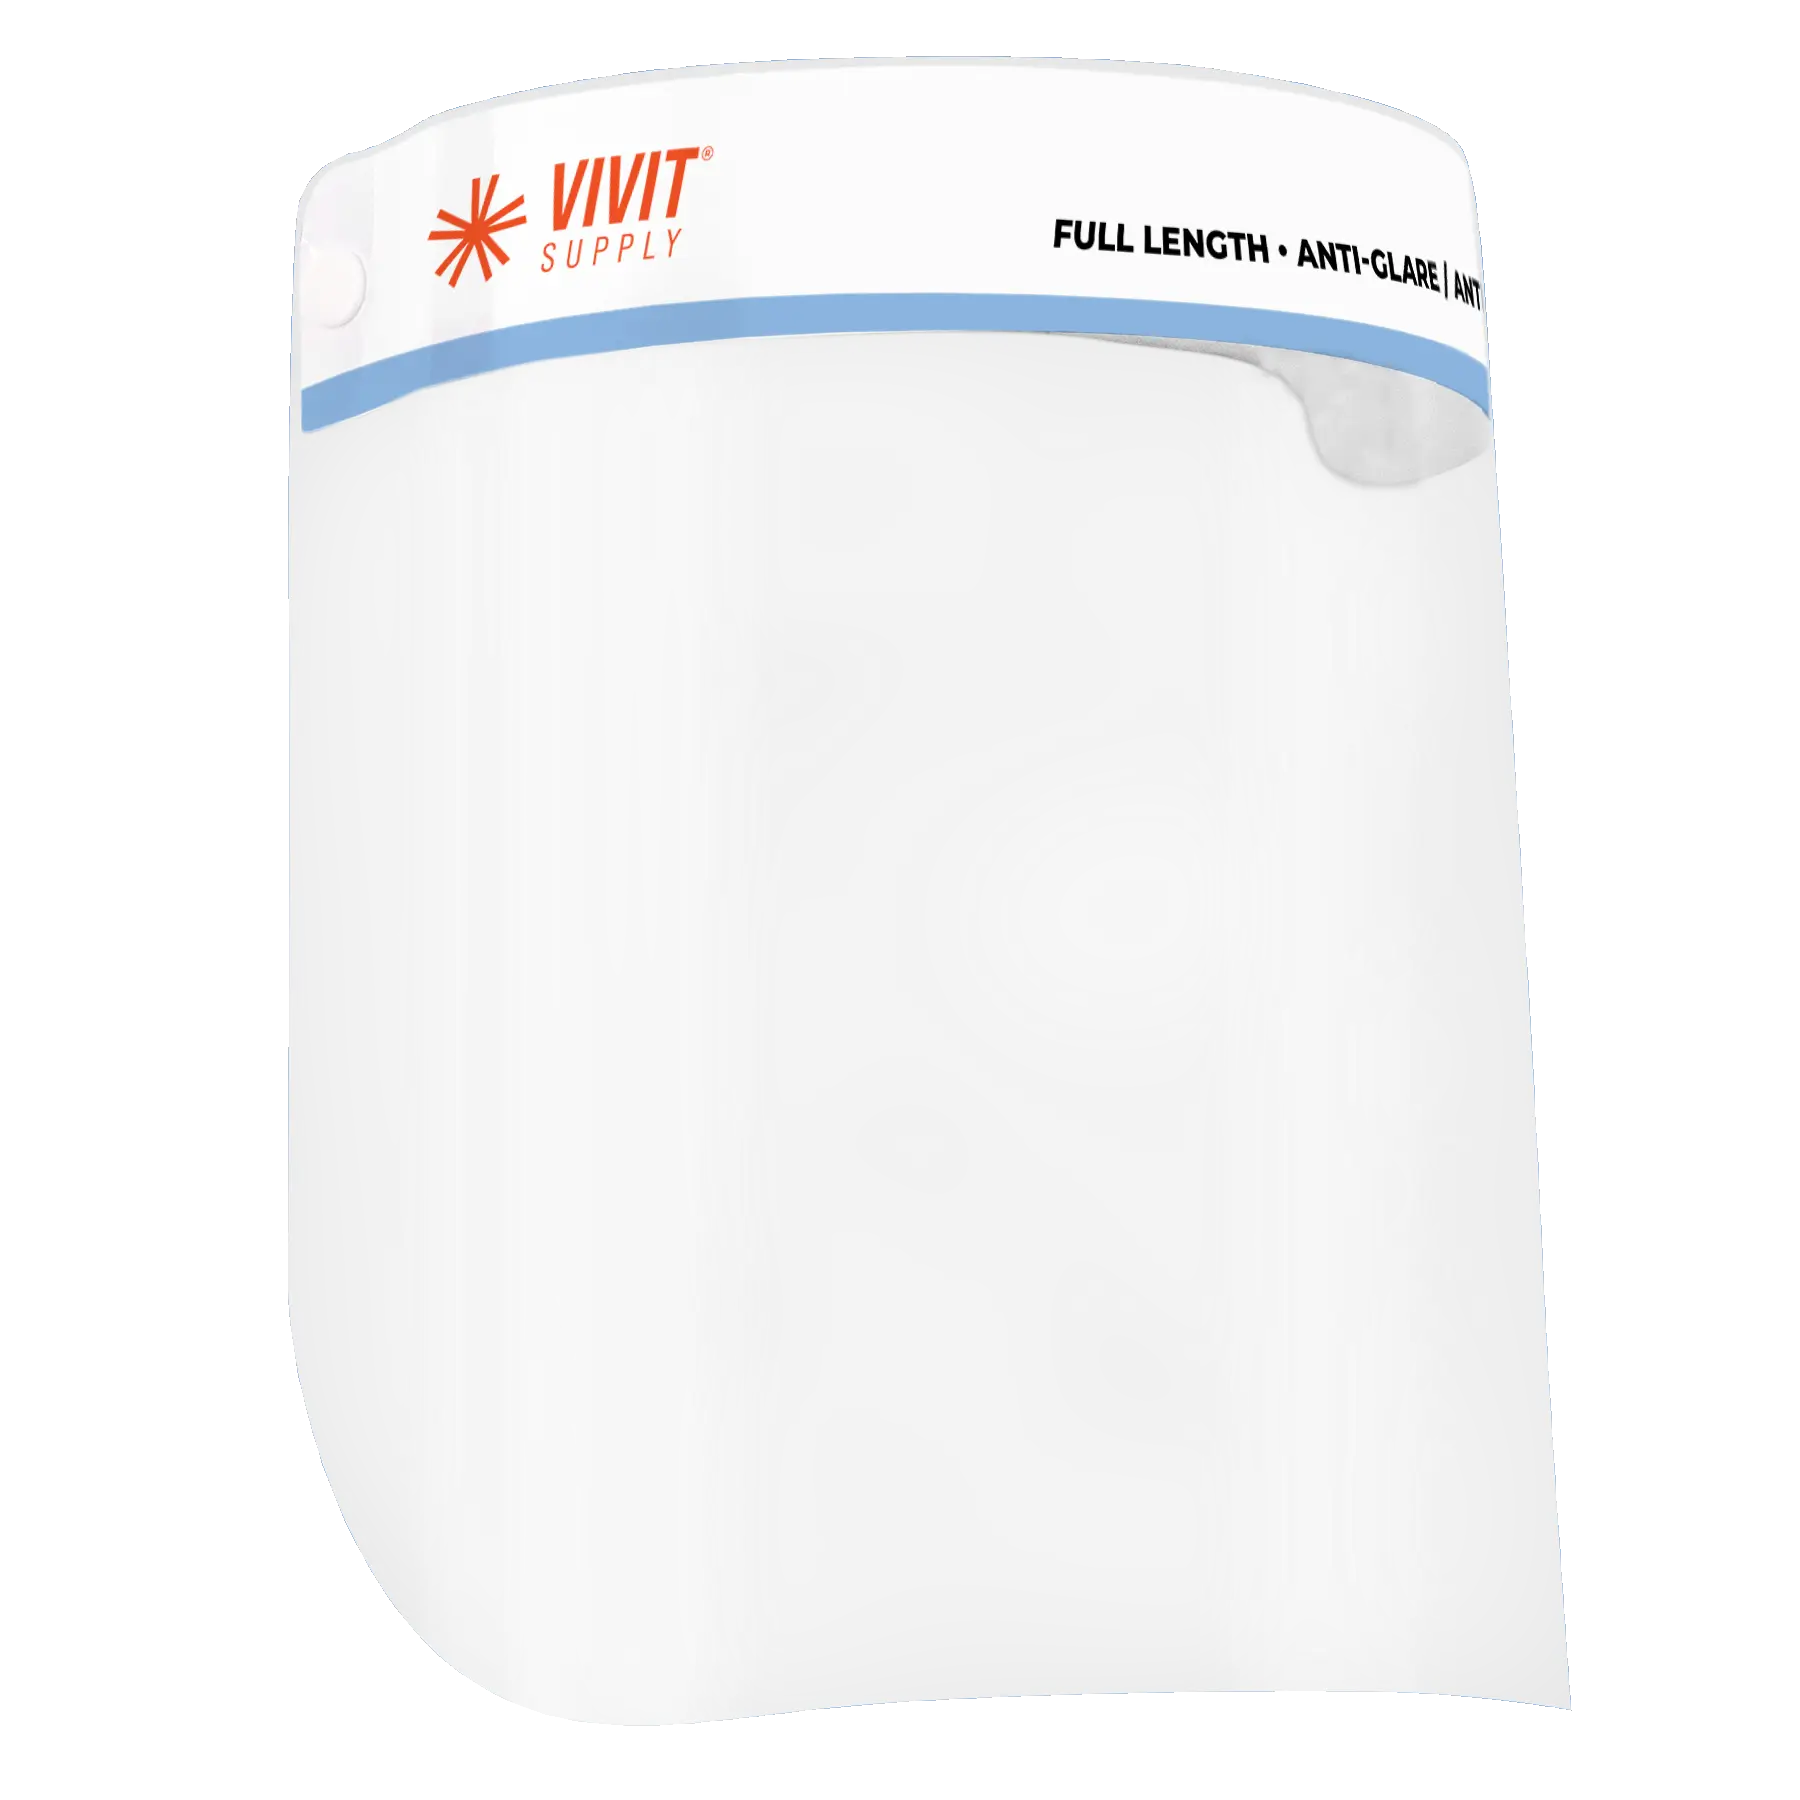
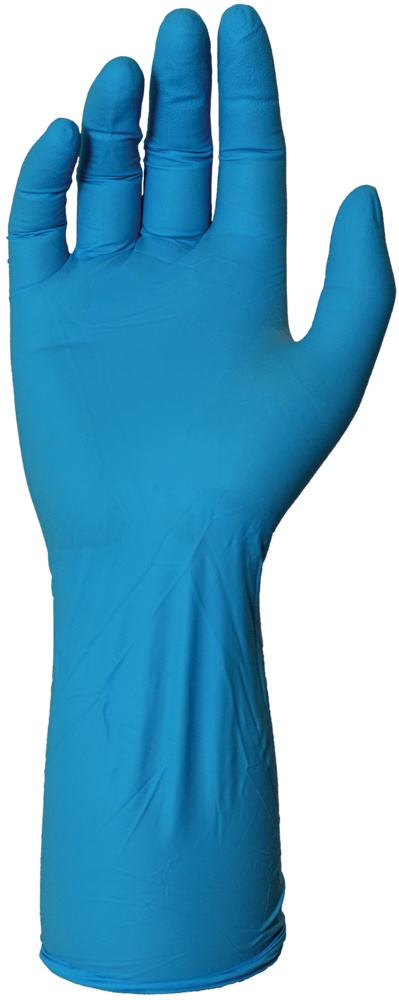
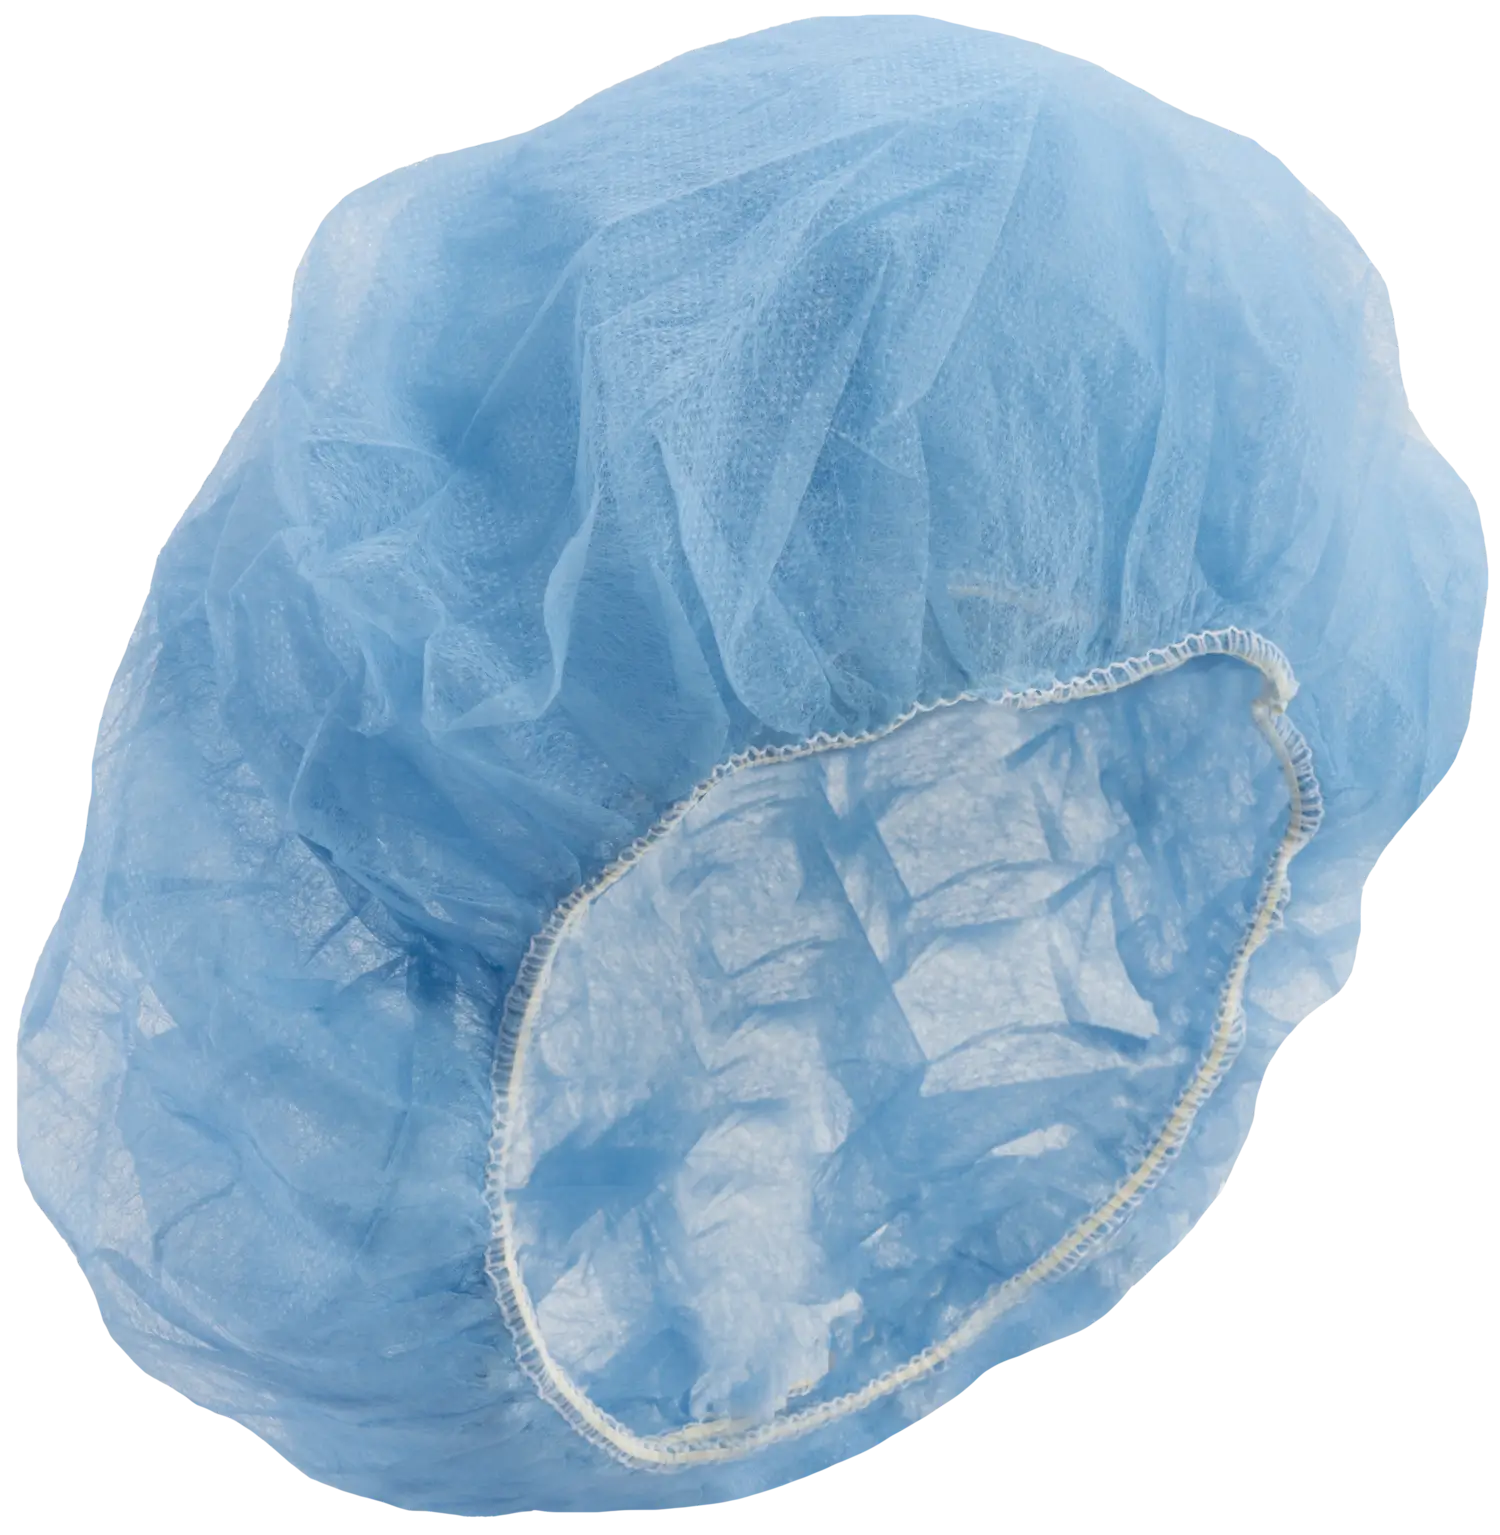
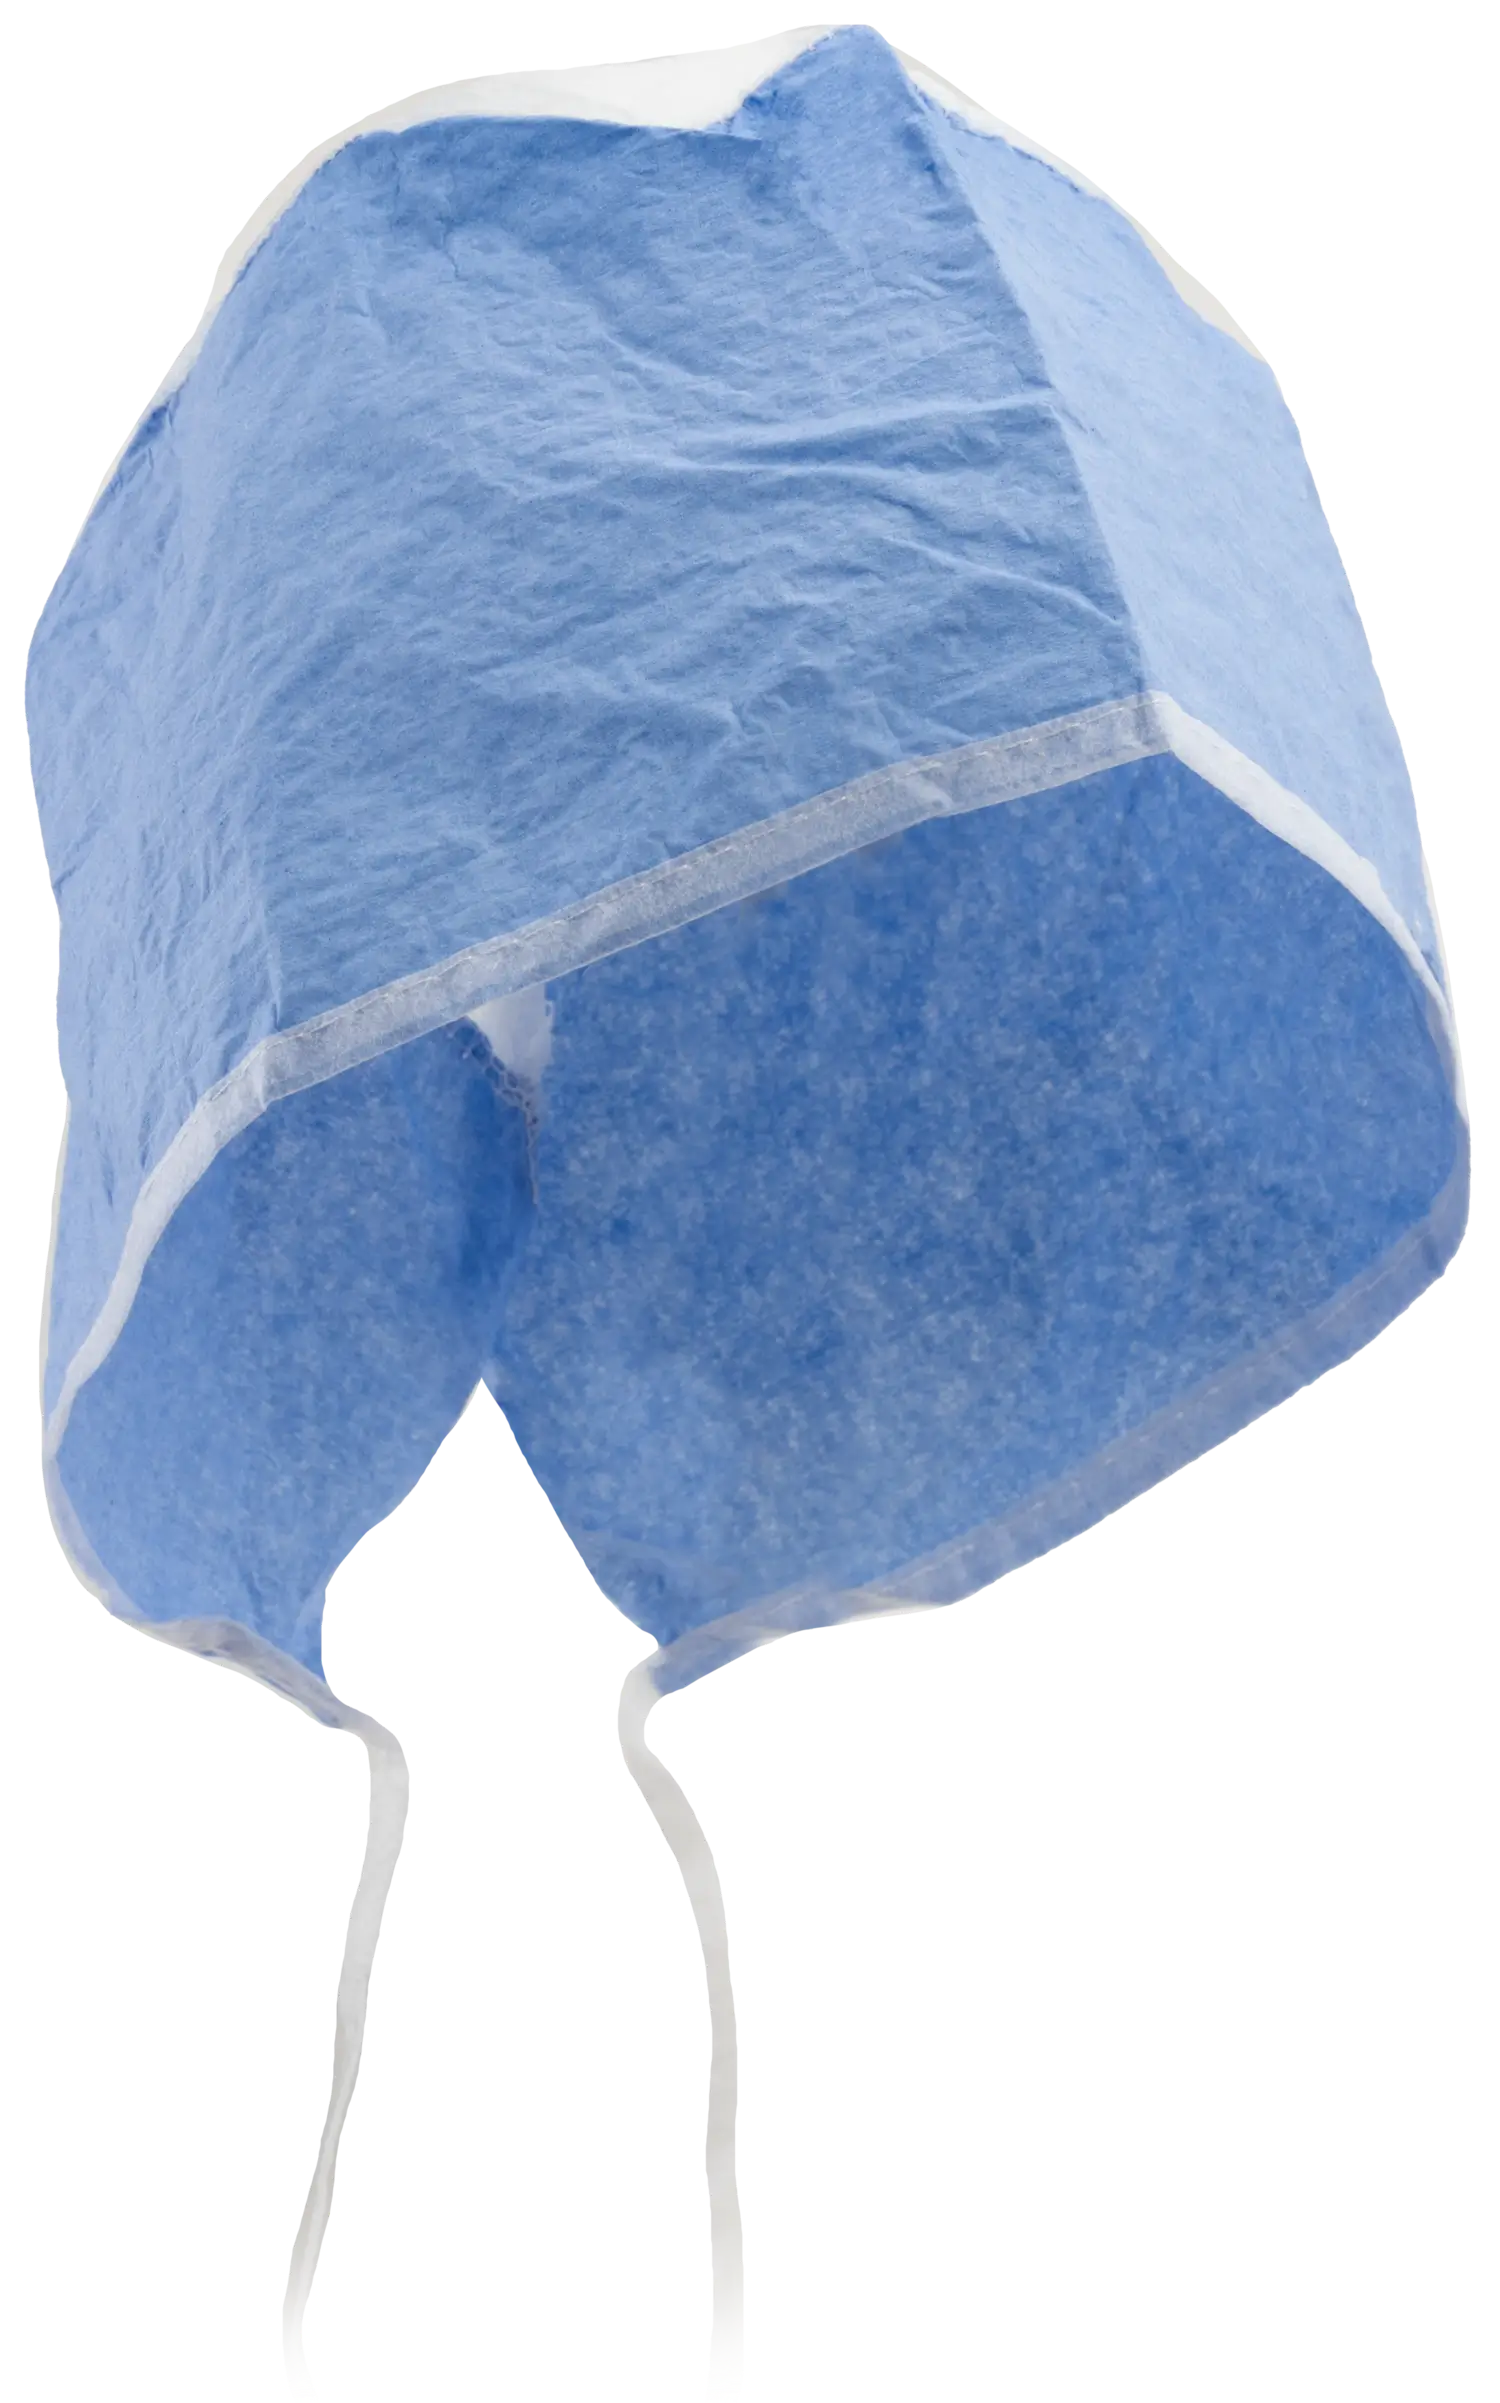
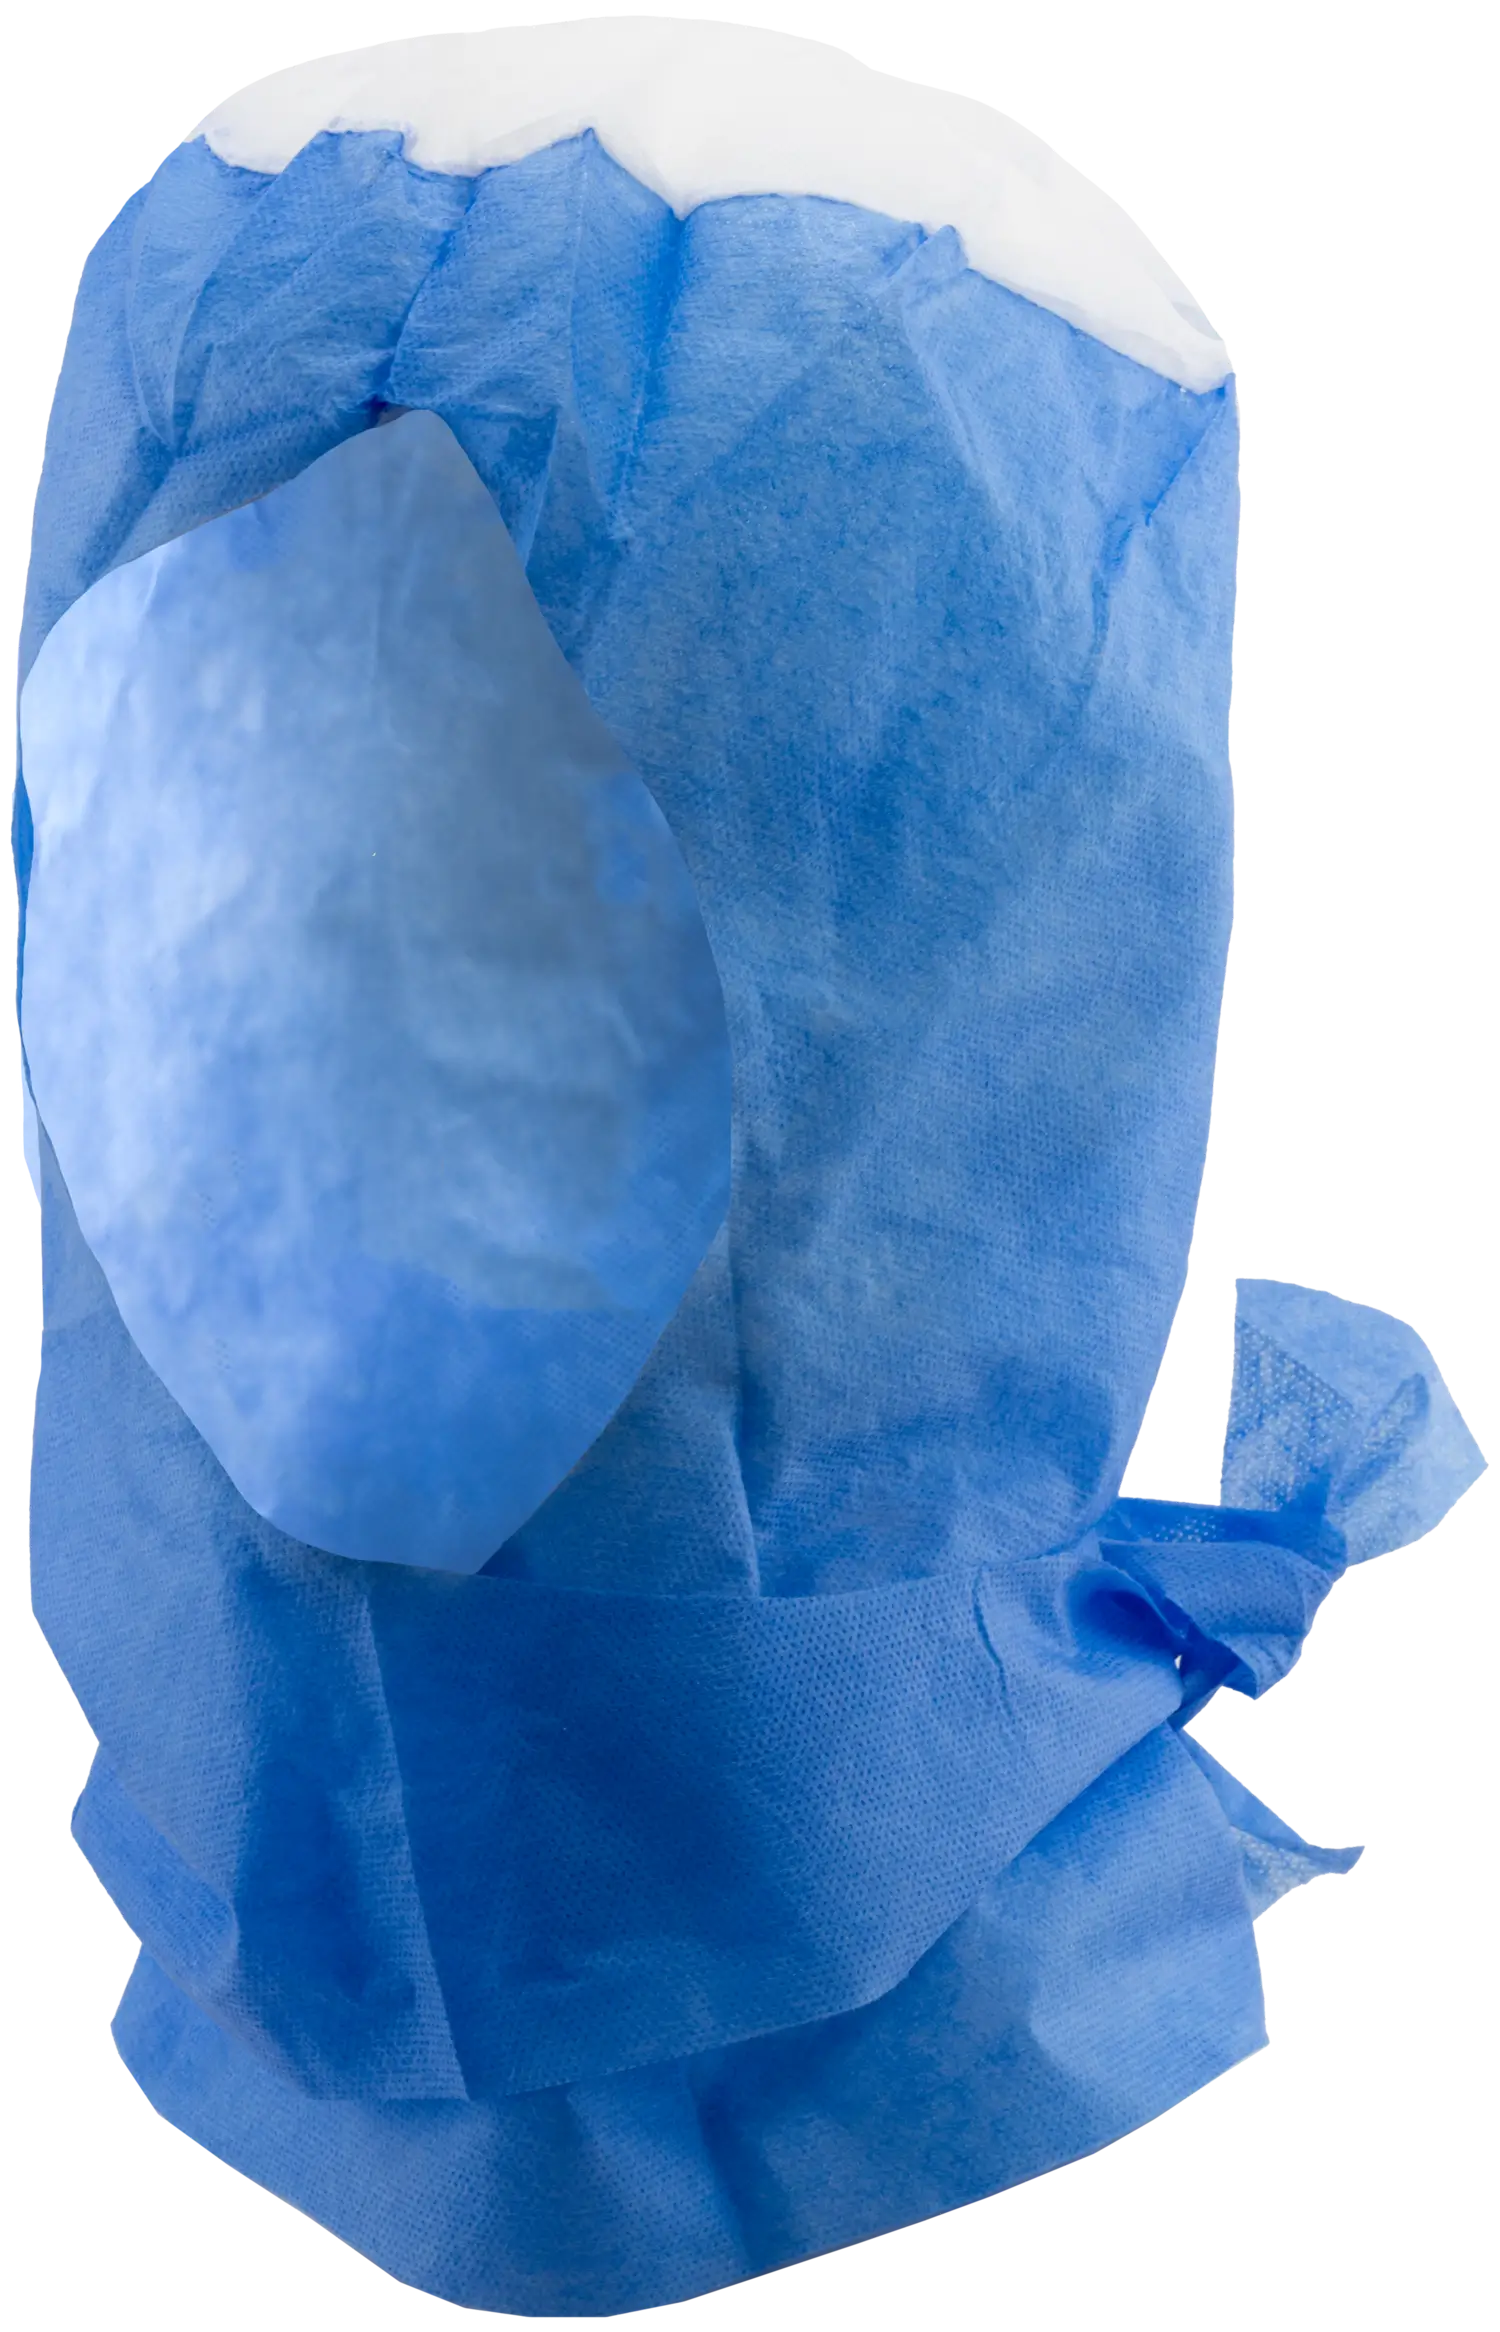
Flu season severity naturally affects hospital patient volumes and PPE usage. Regardless of severity, PPE usage increases during flu season.
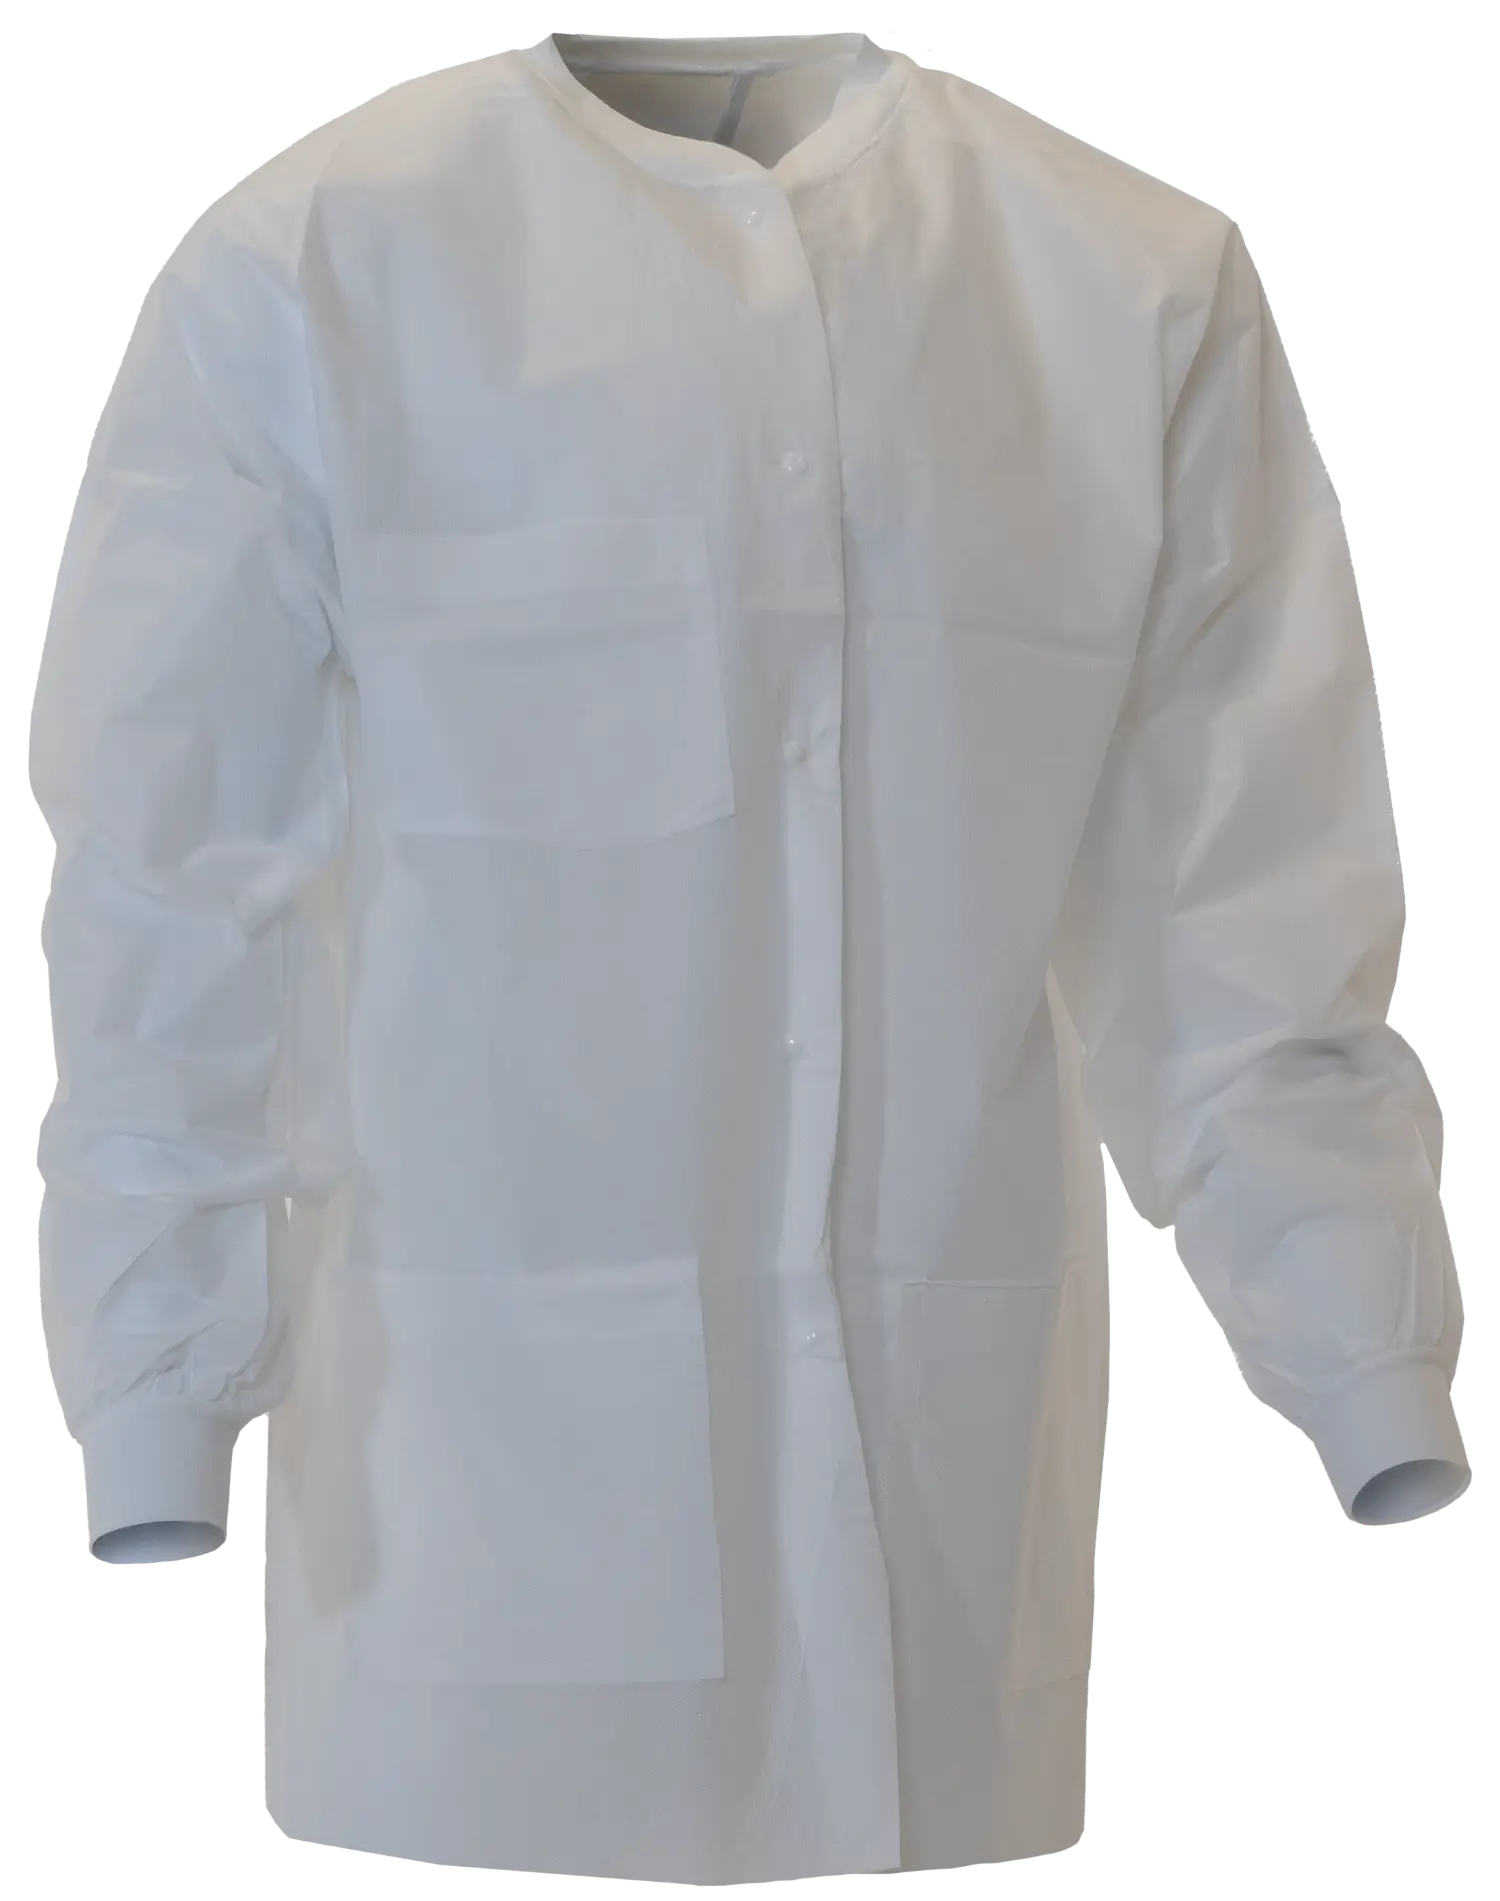
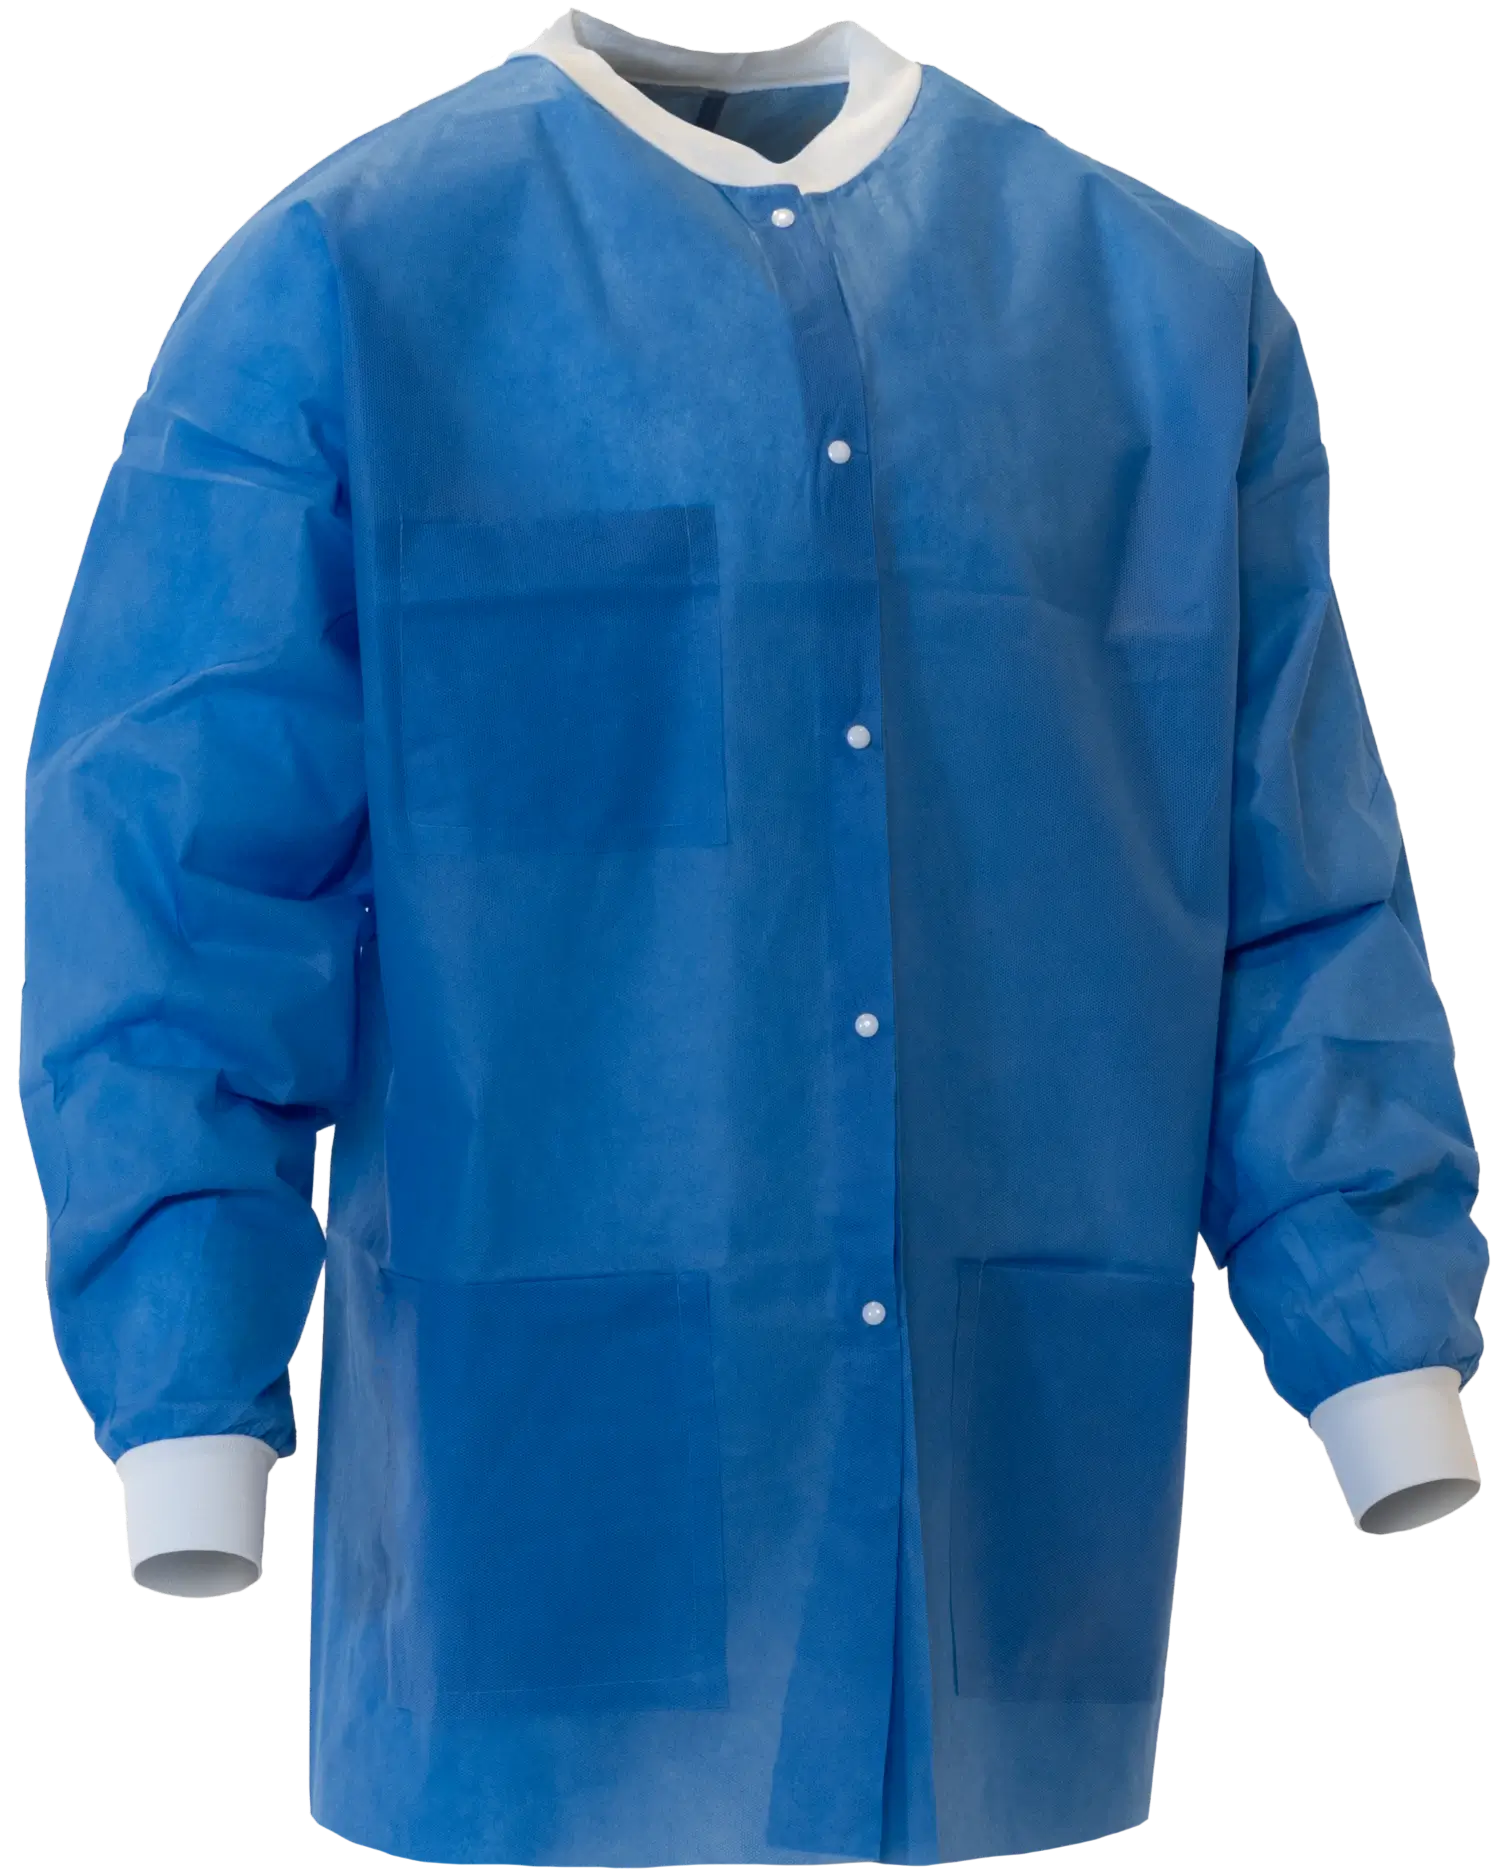
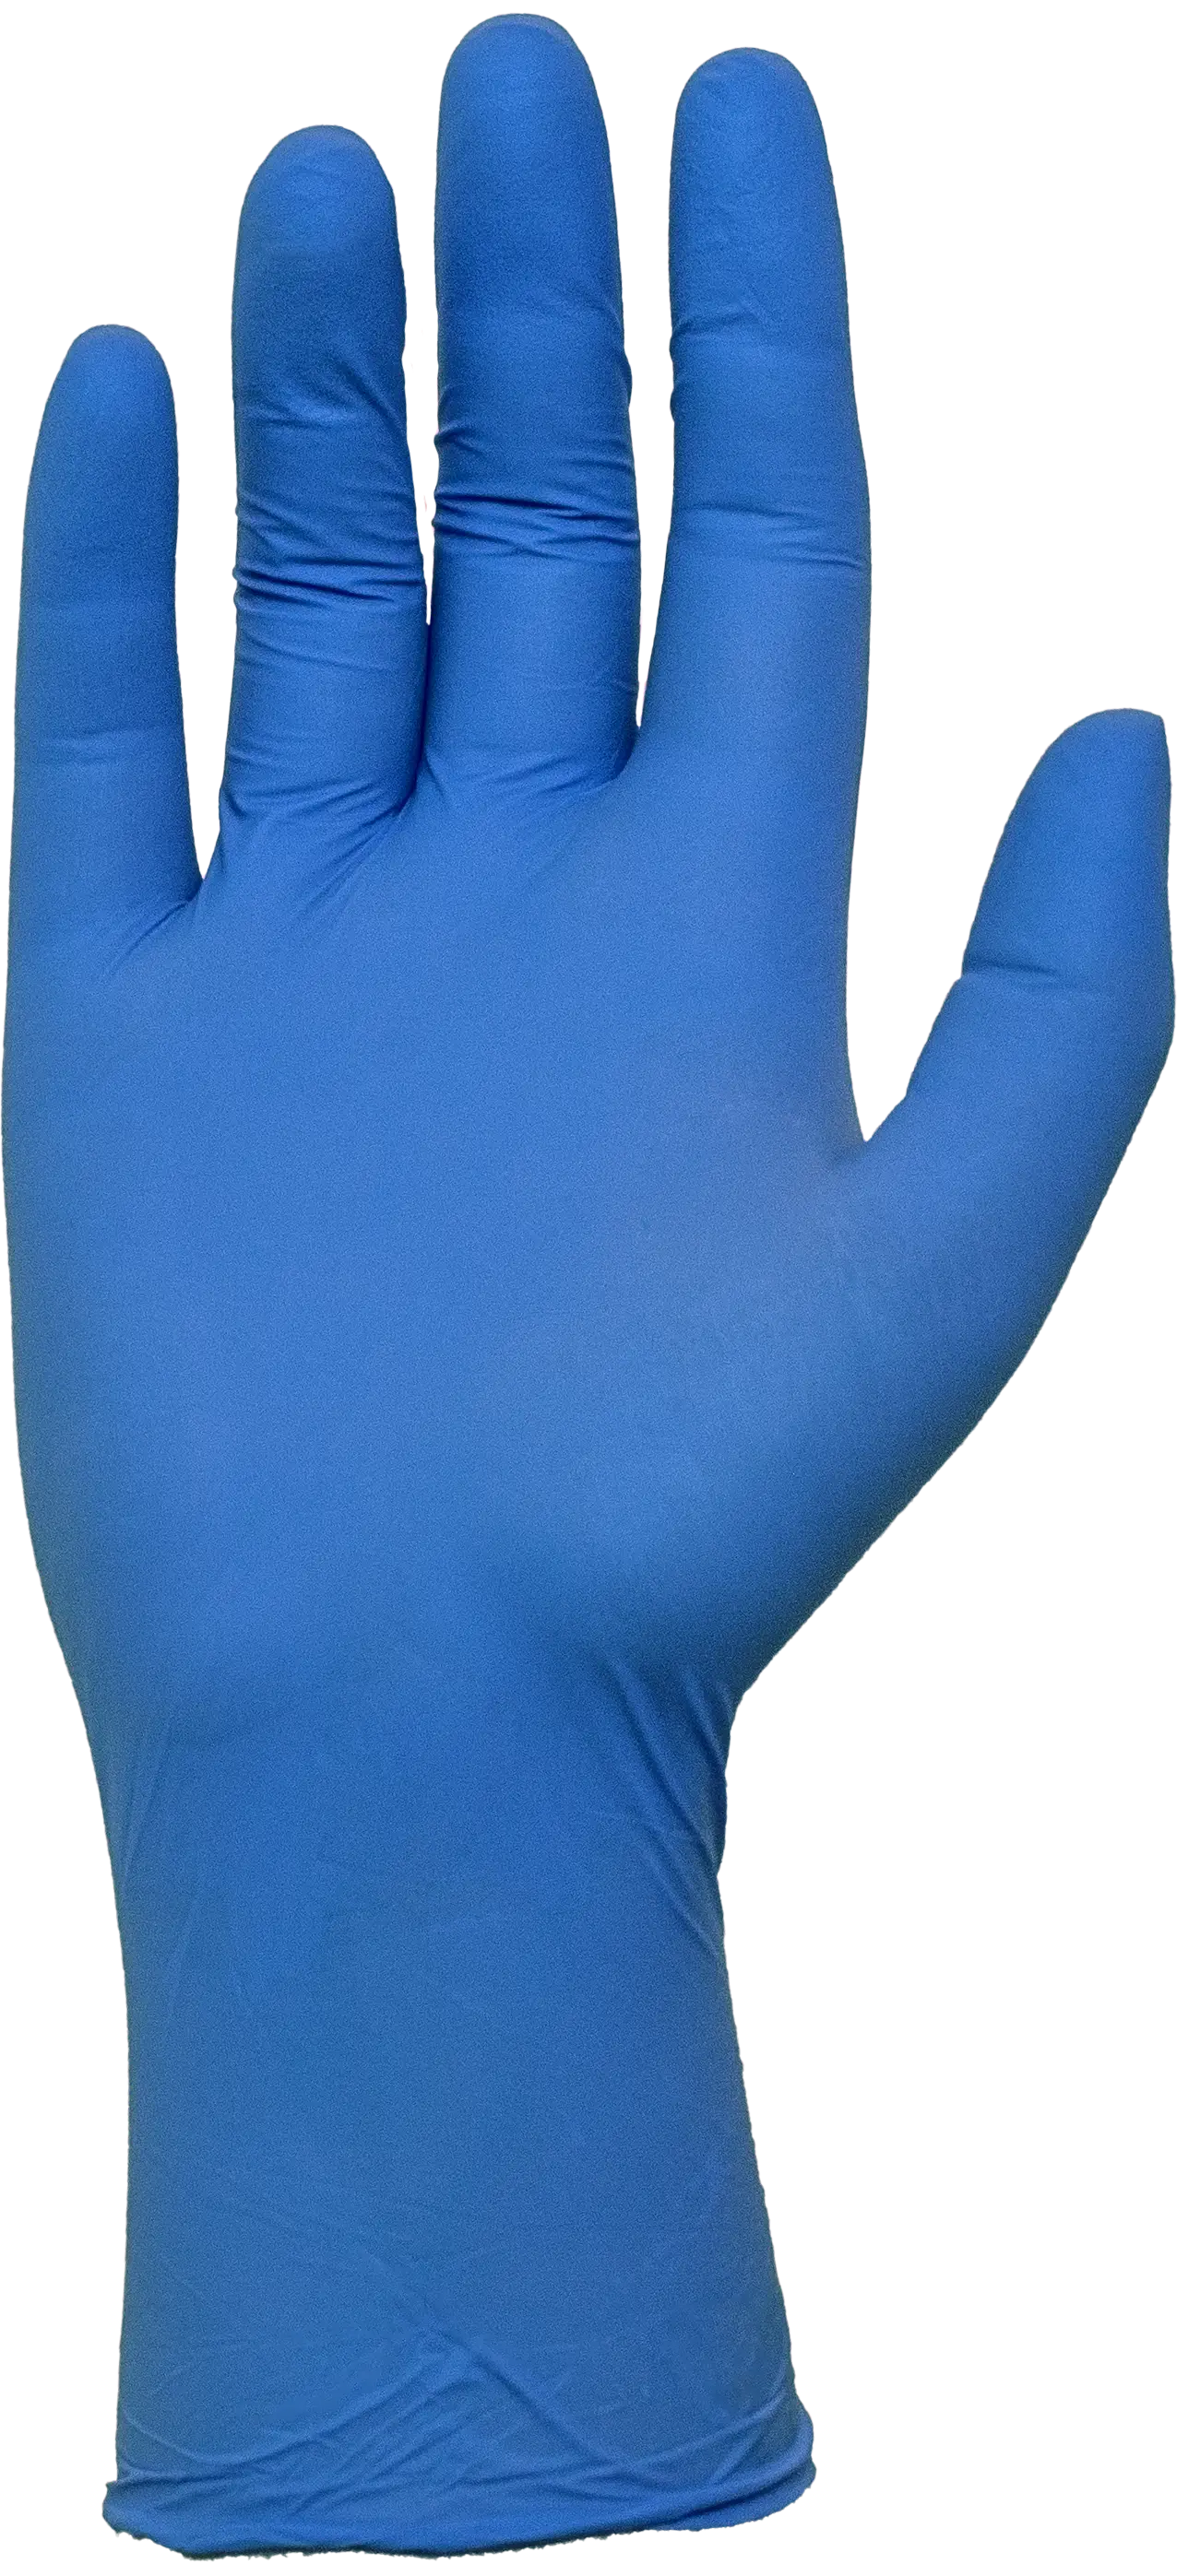
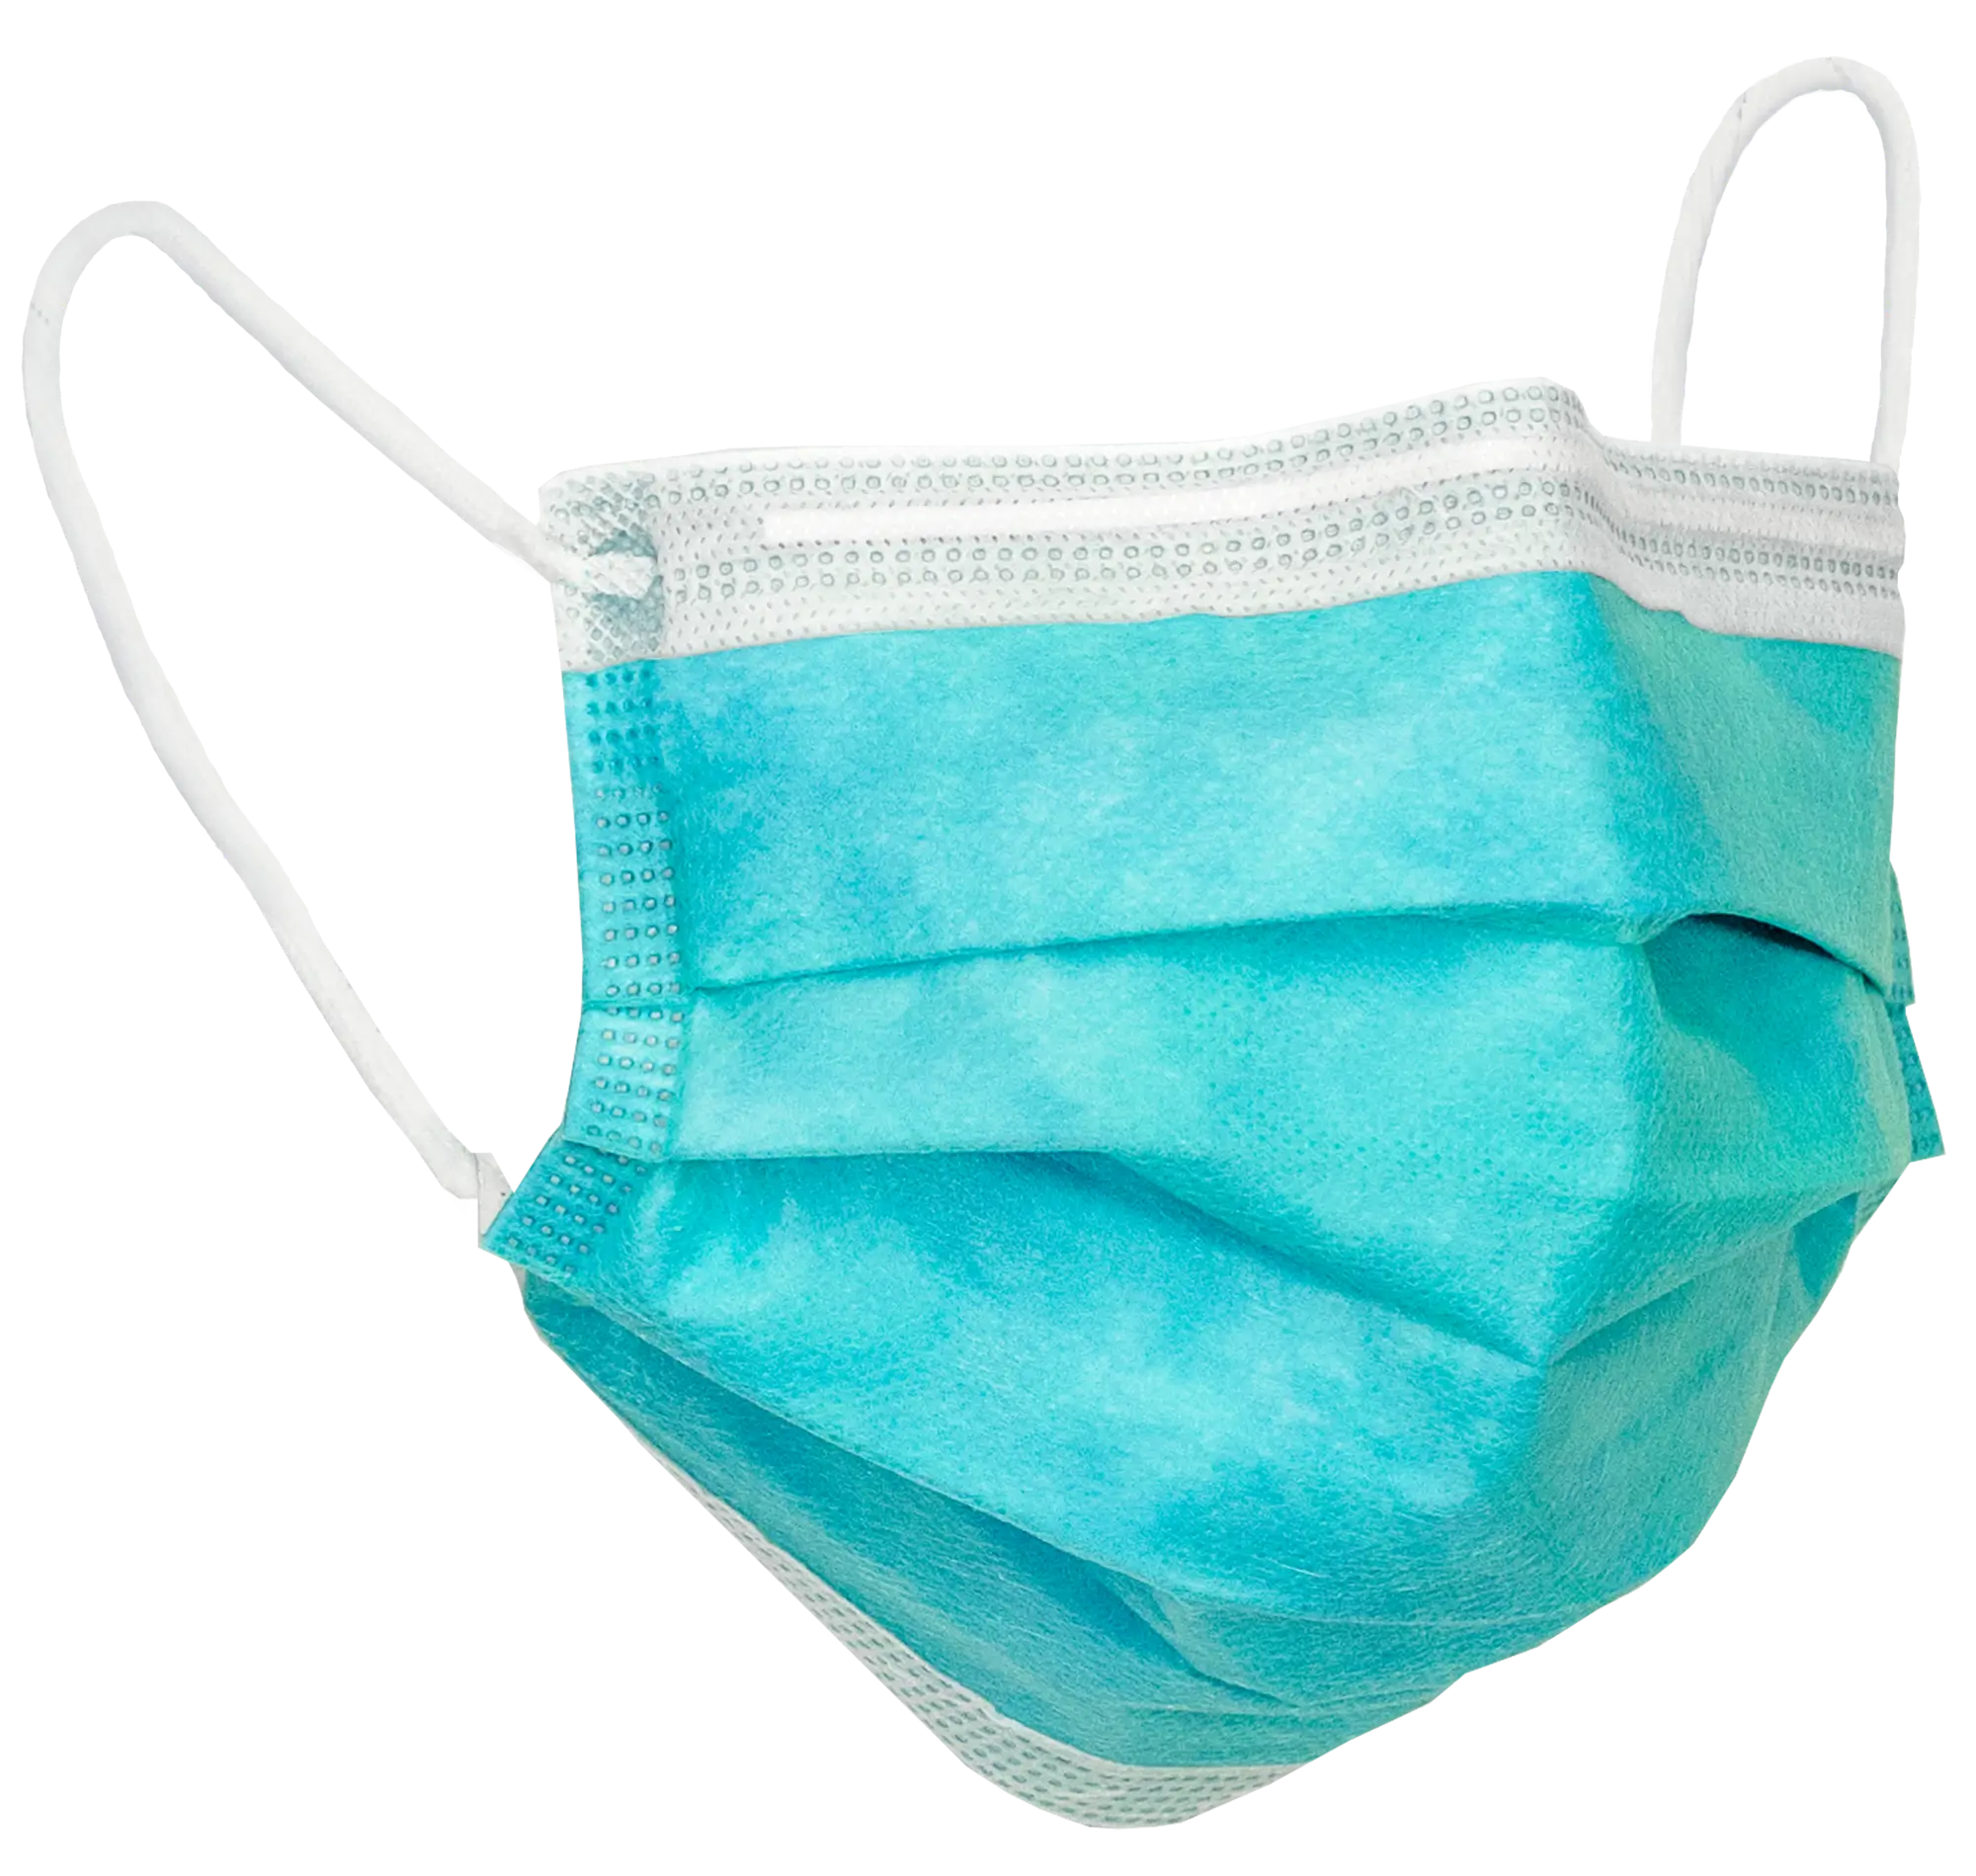
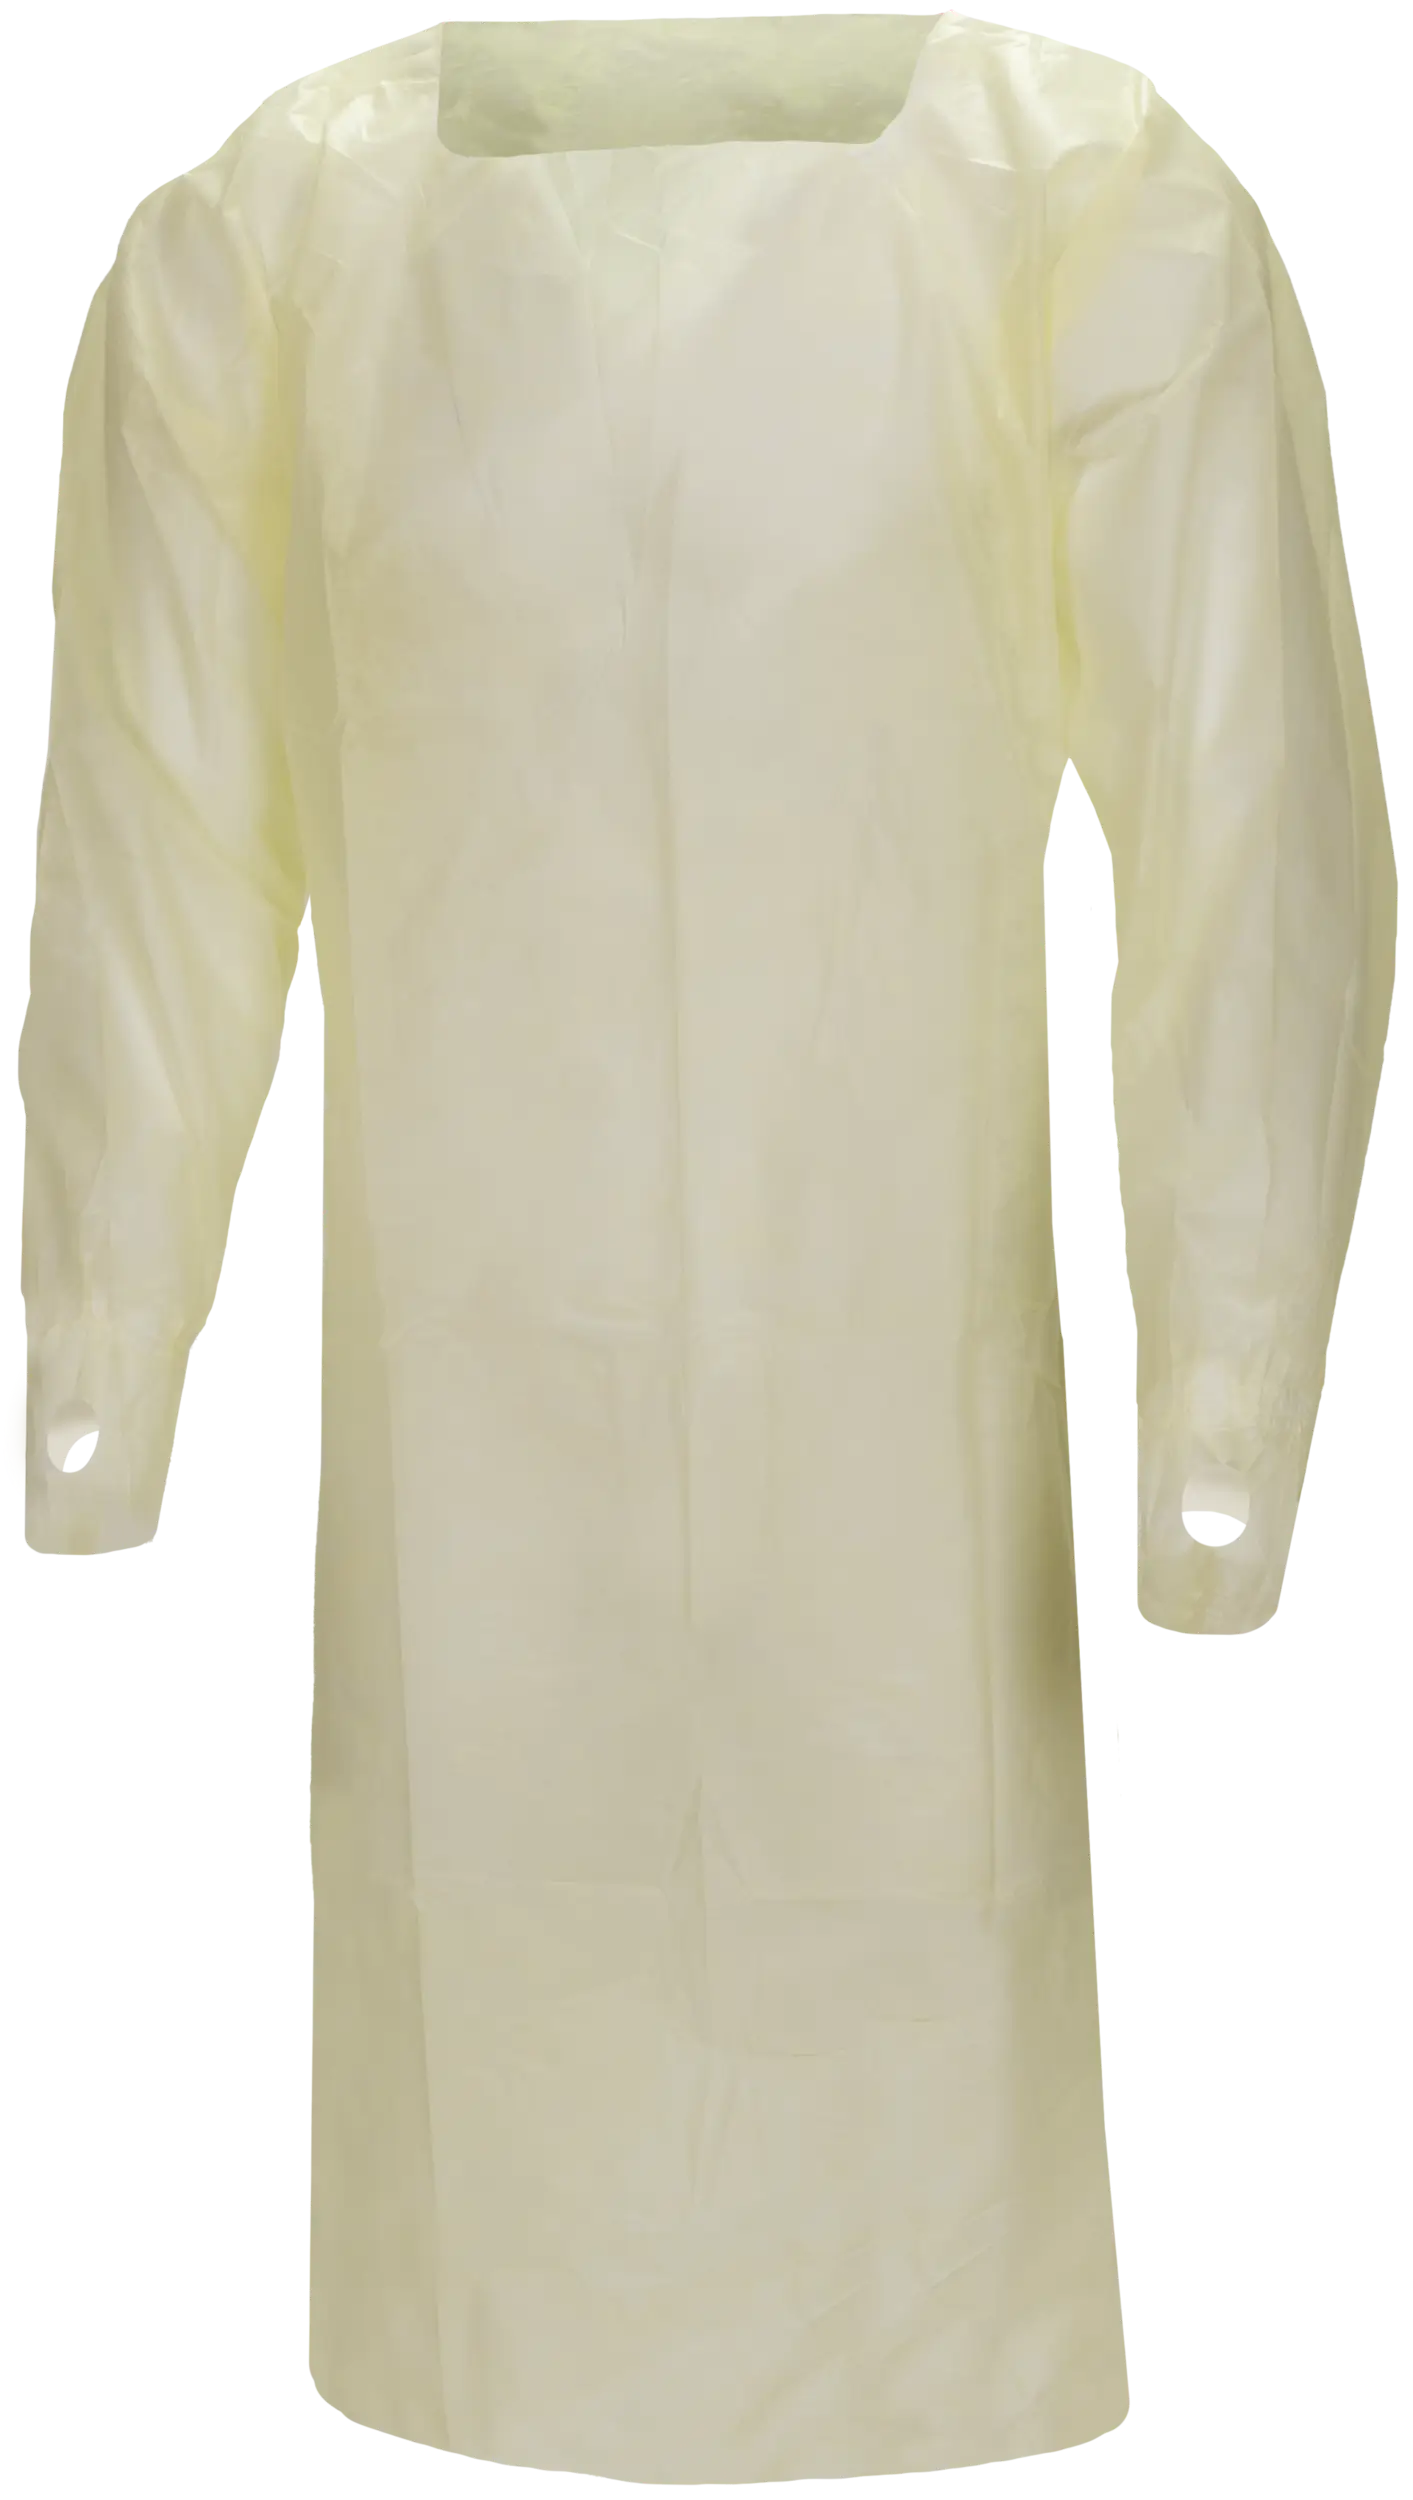
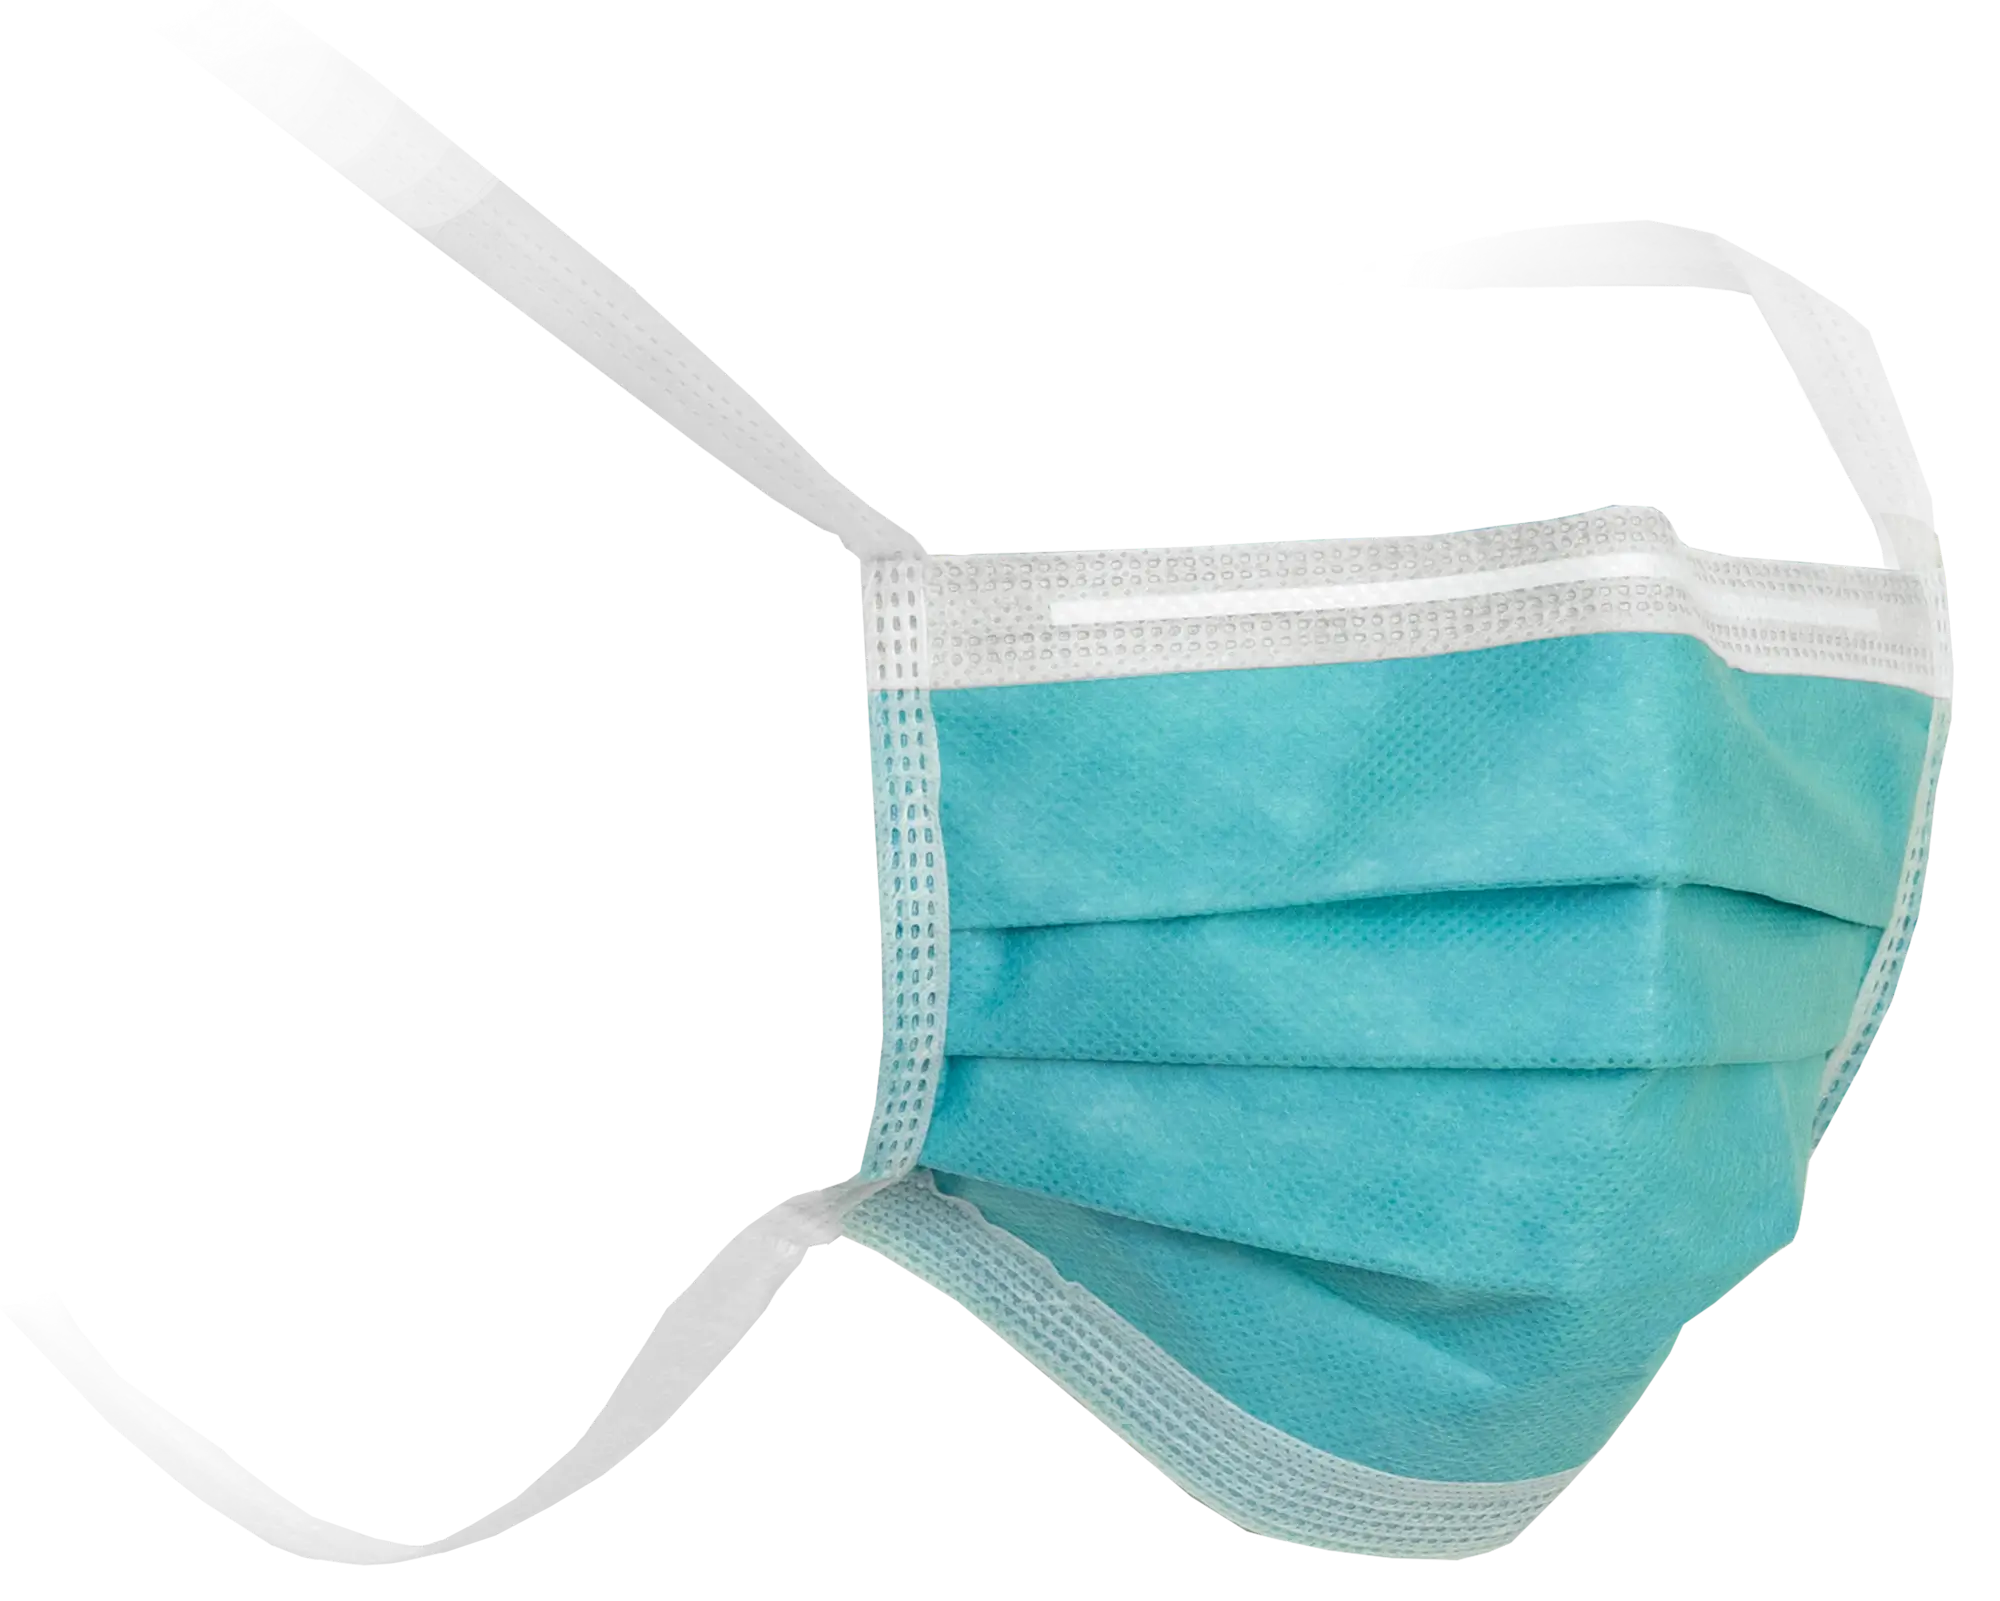
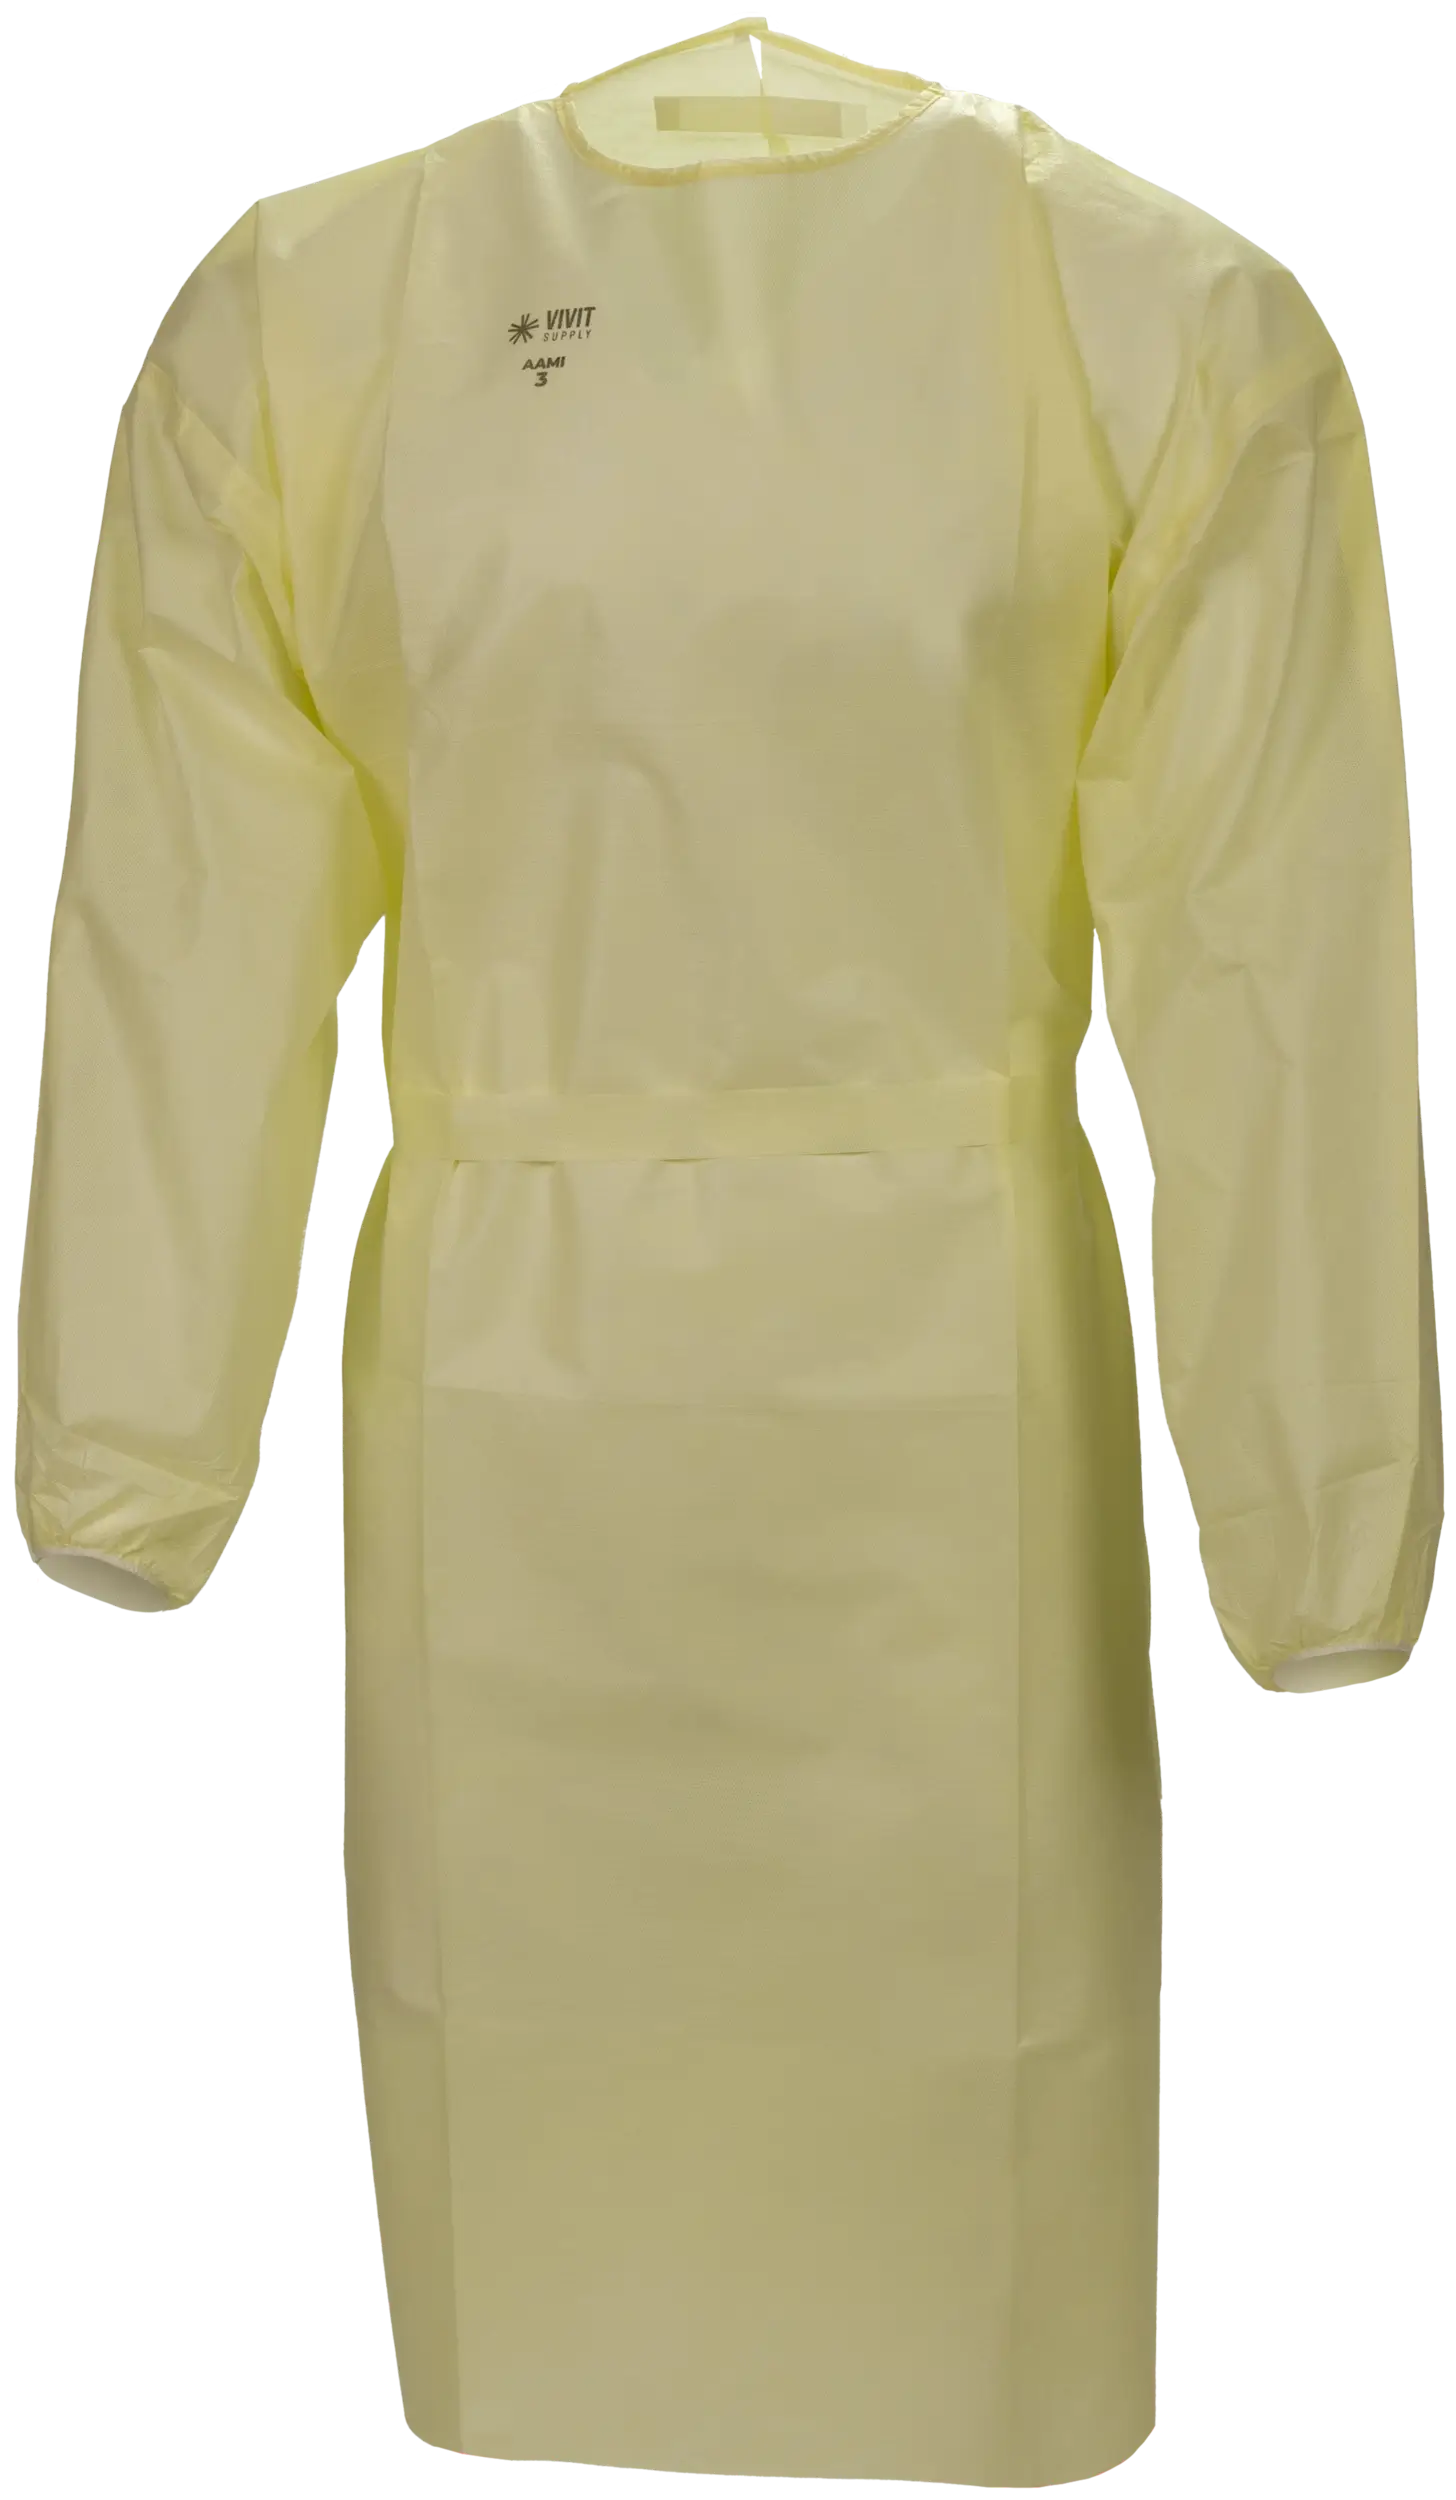
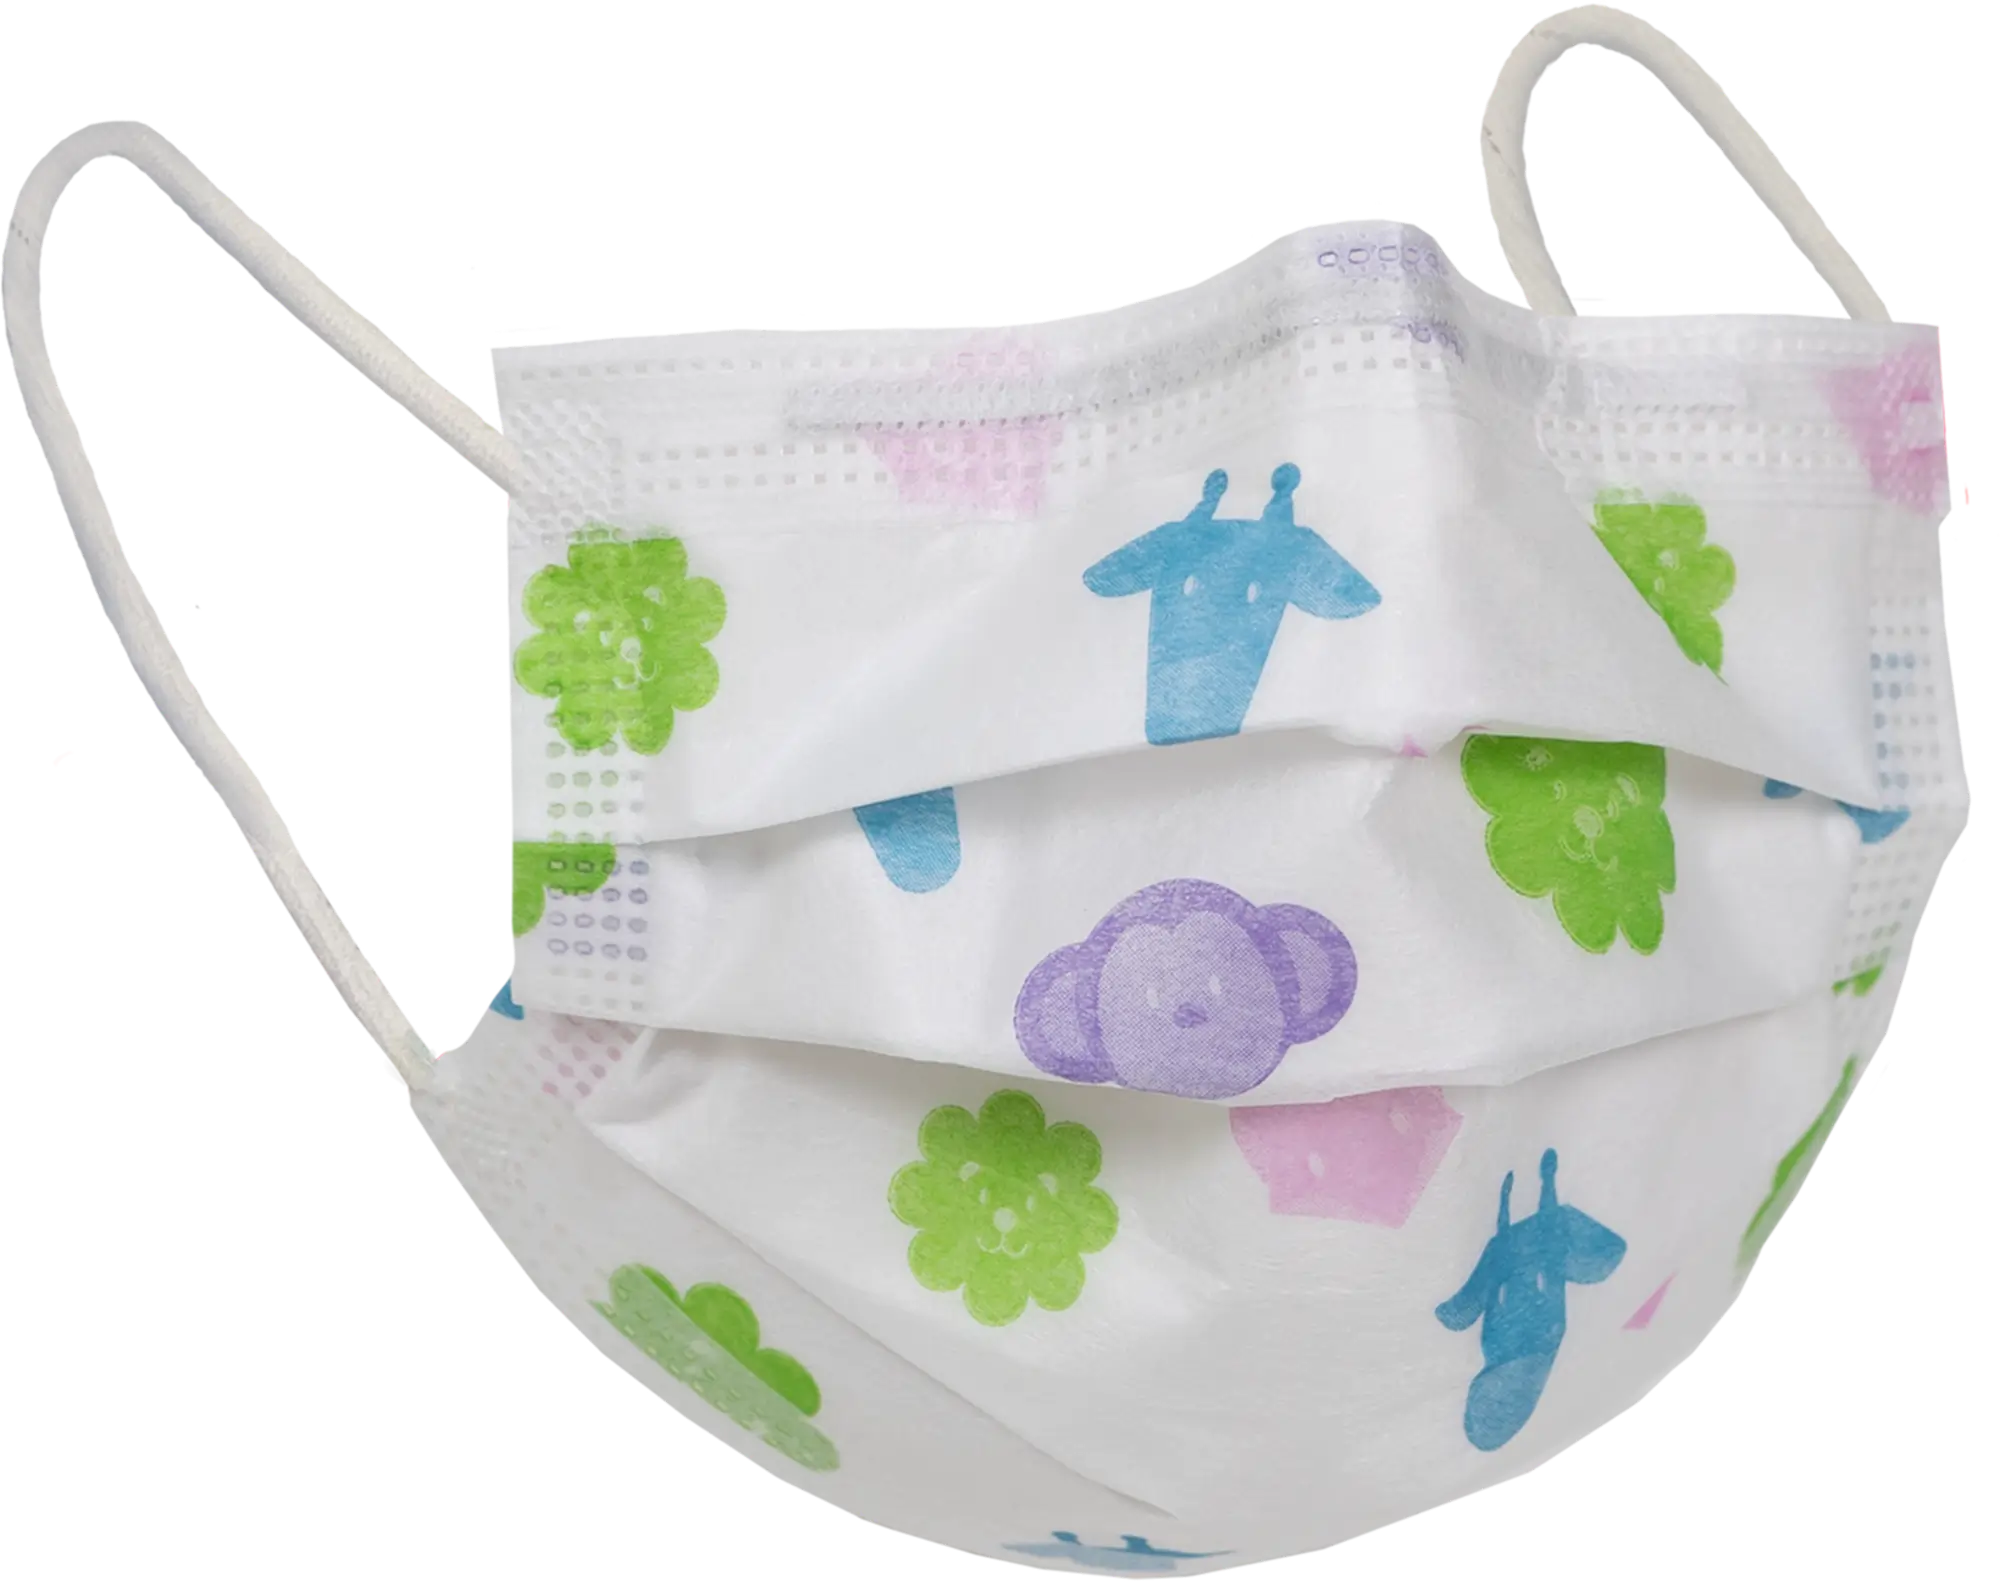
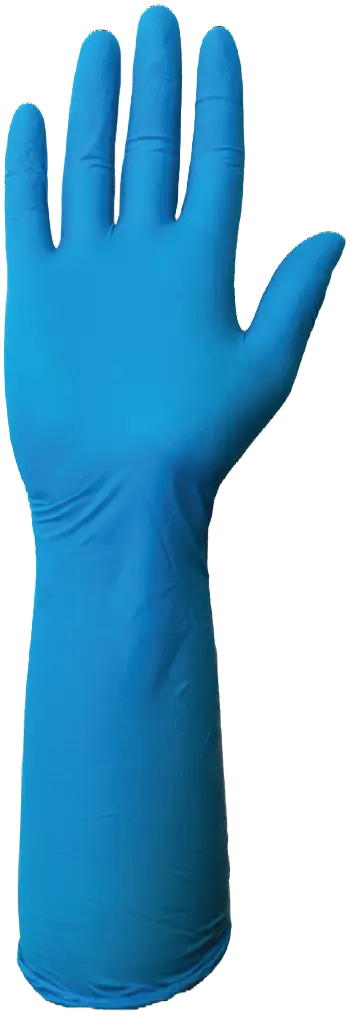
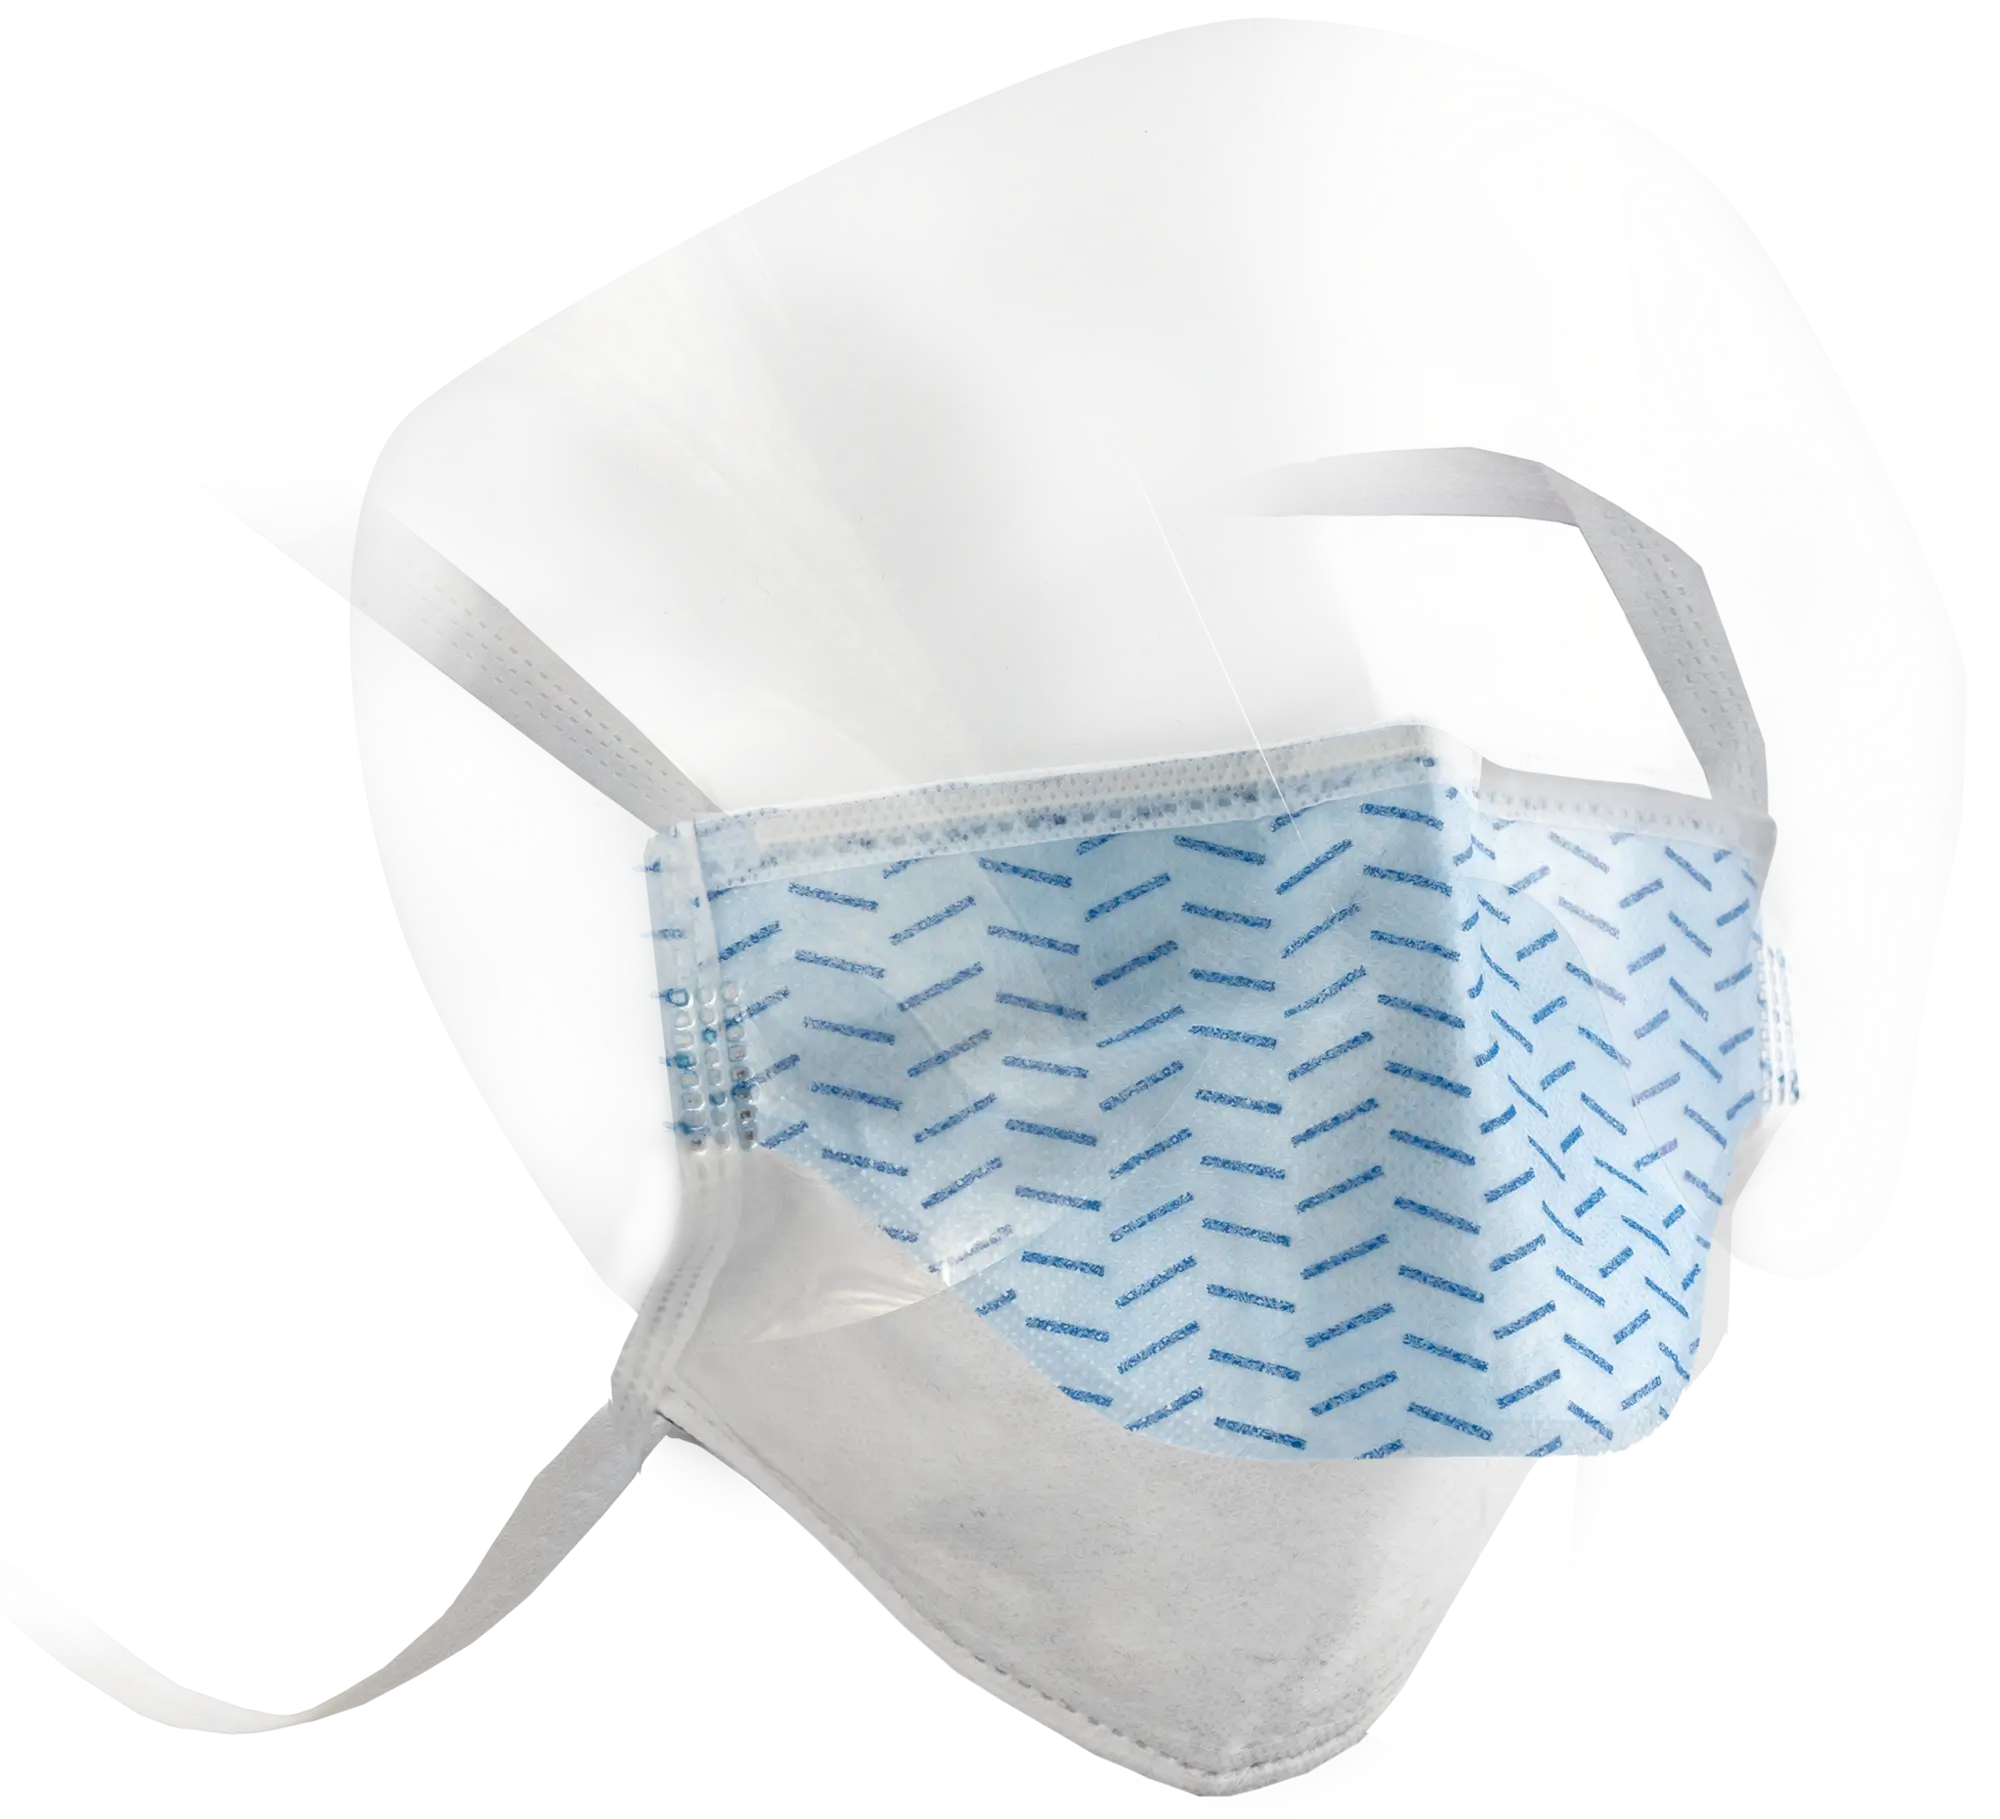
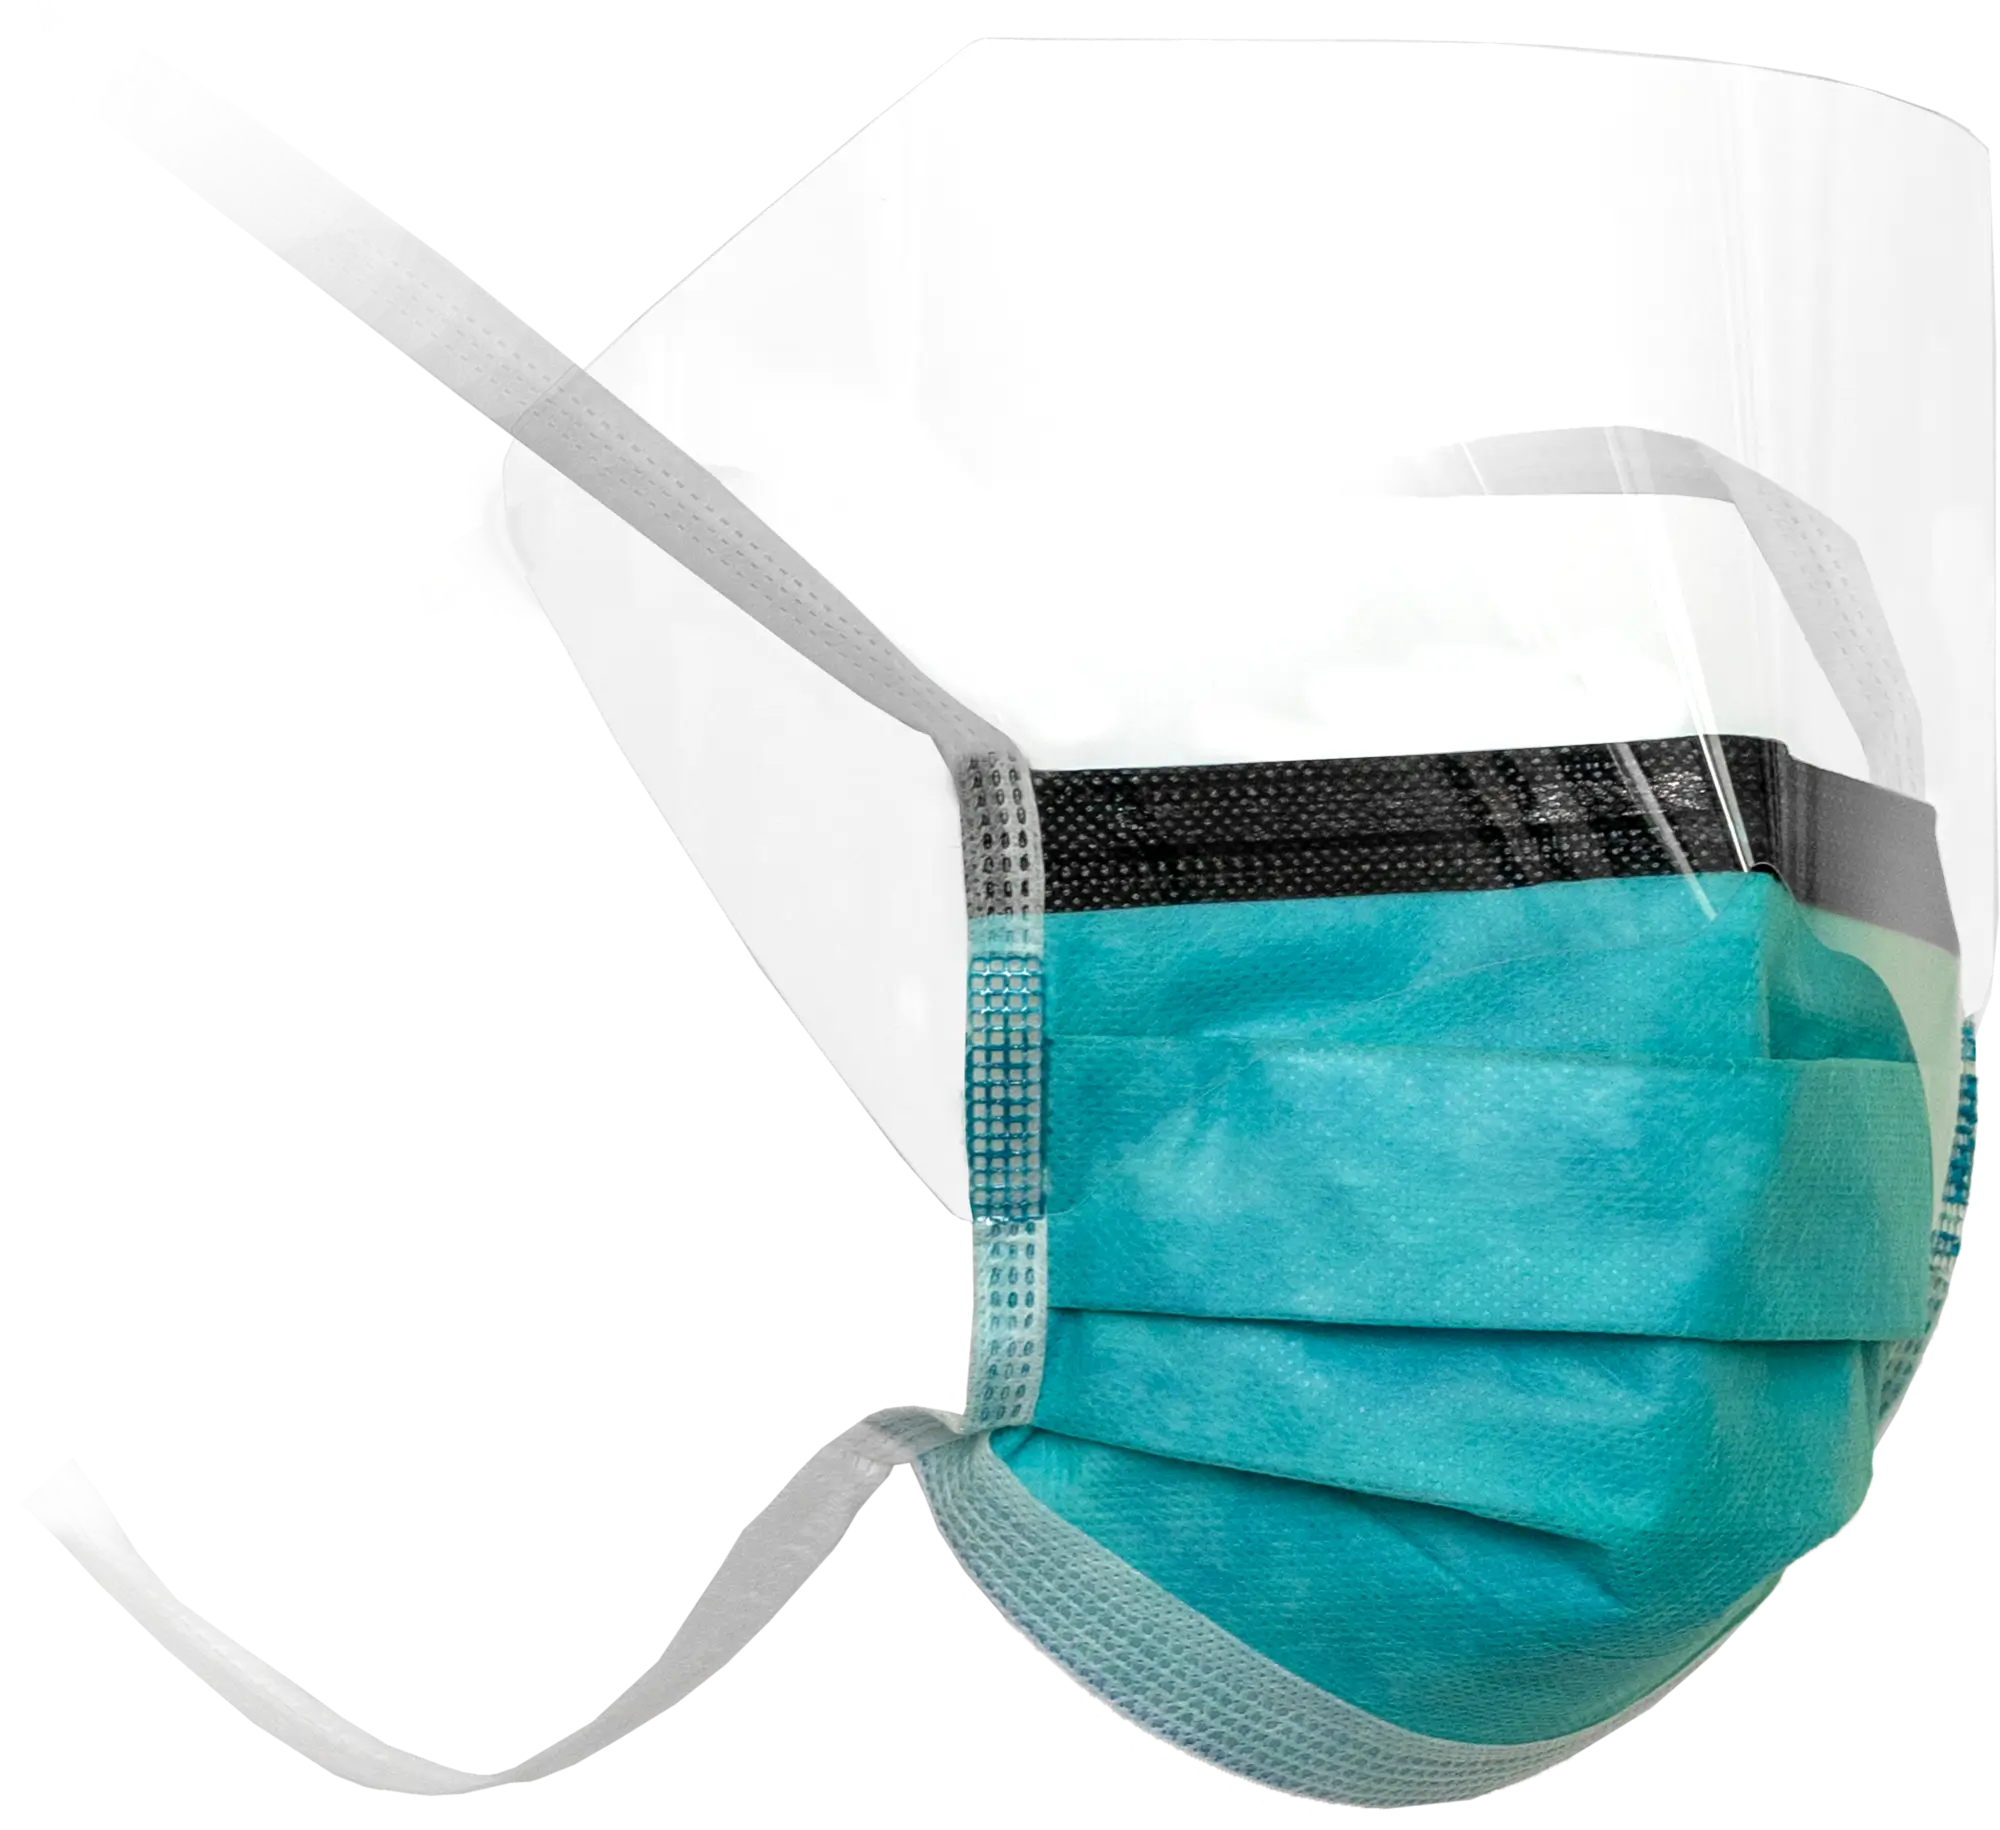
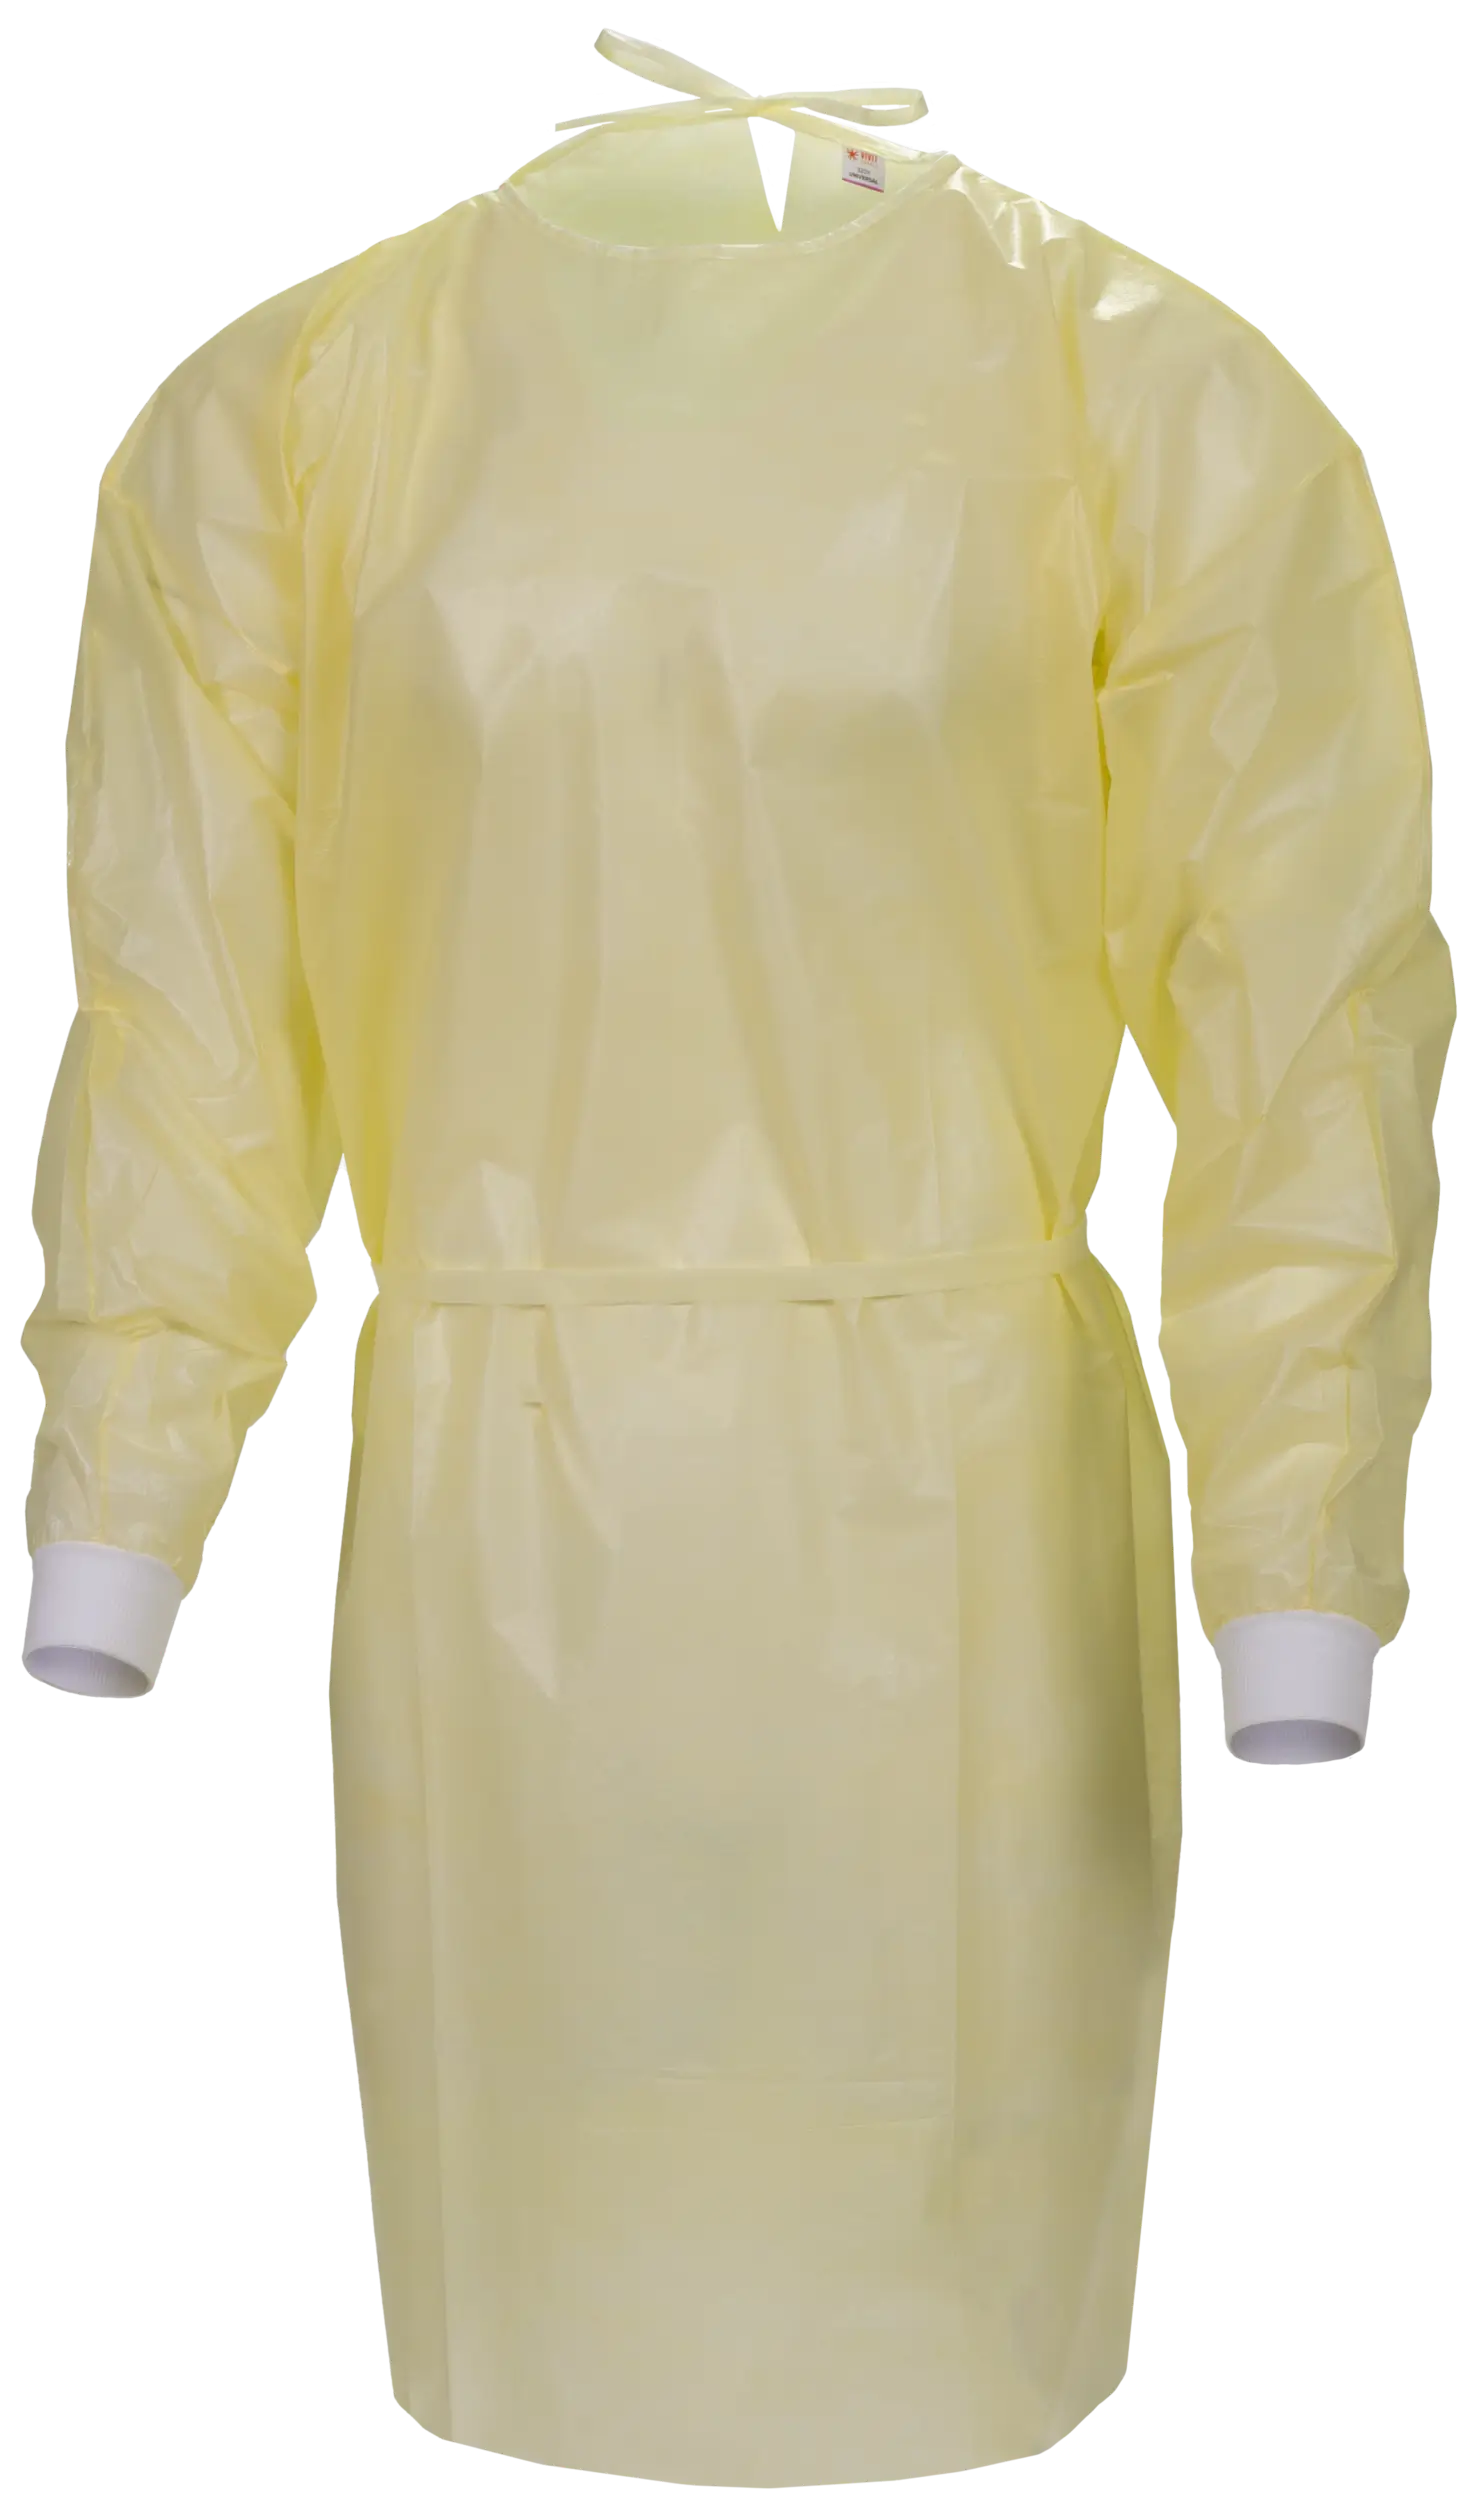
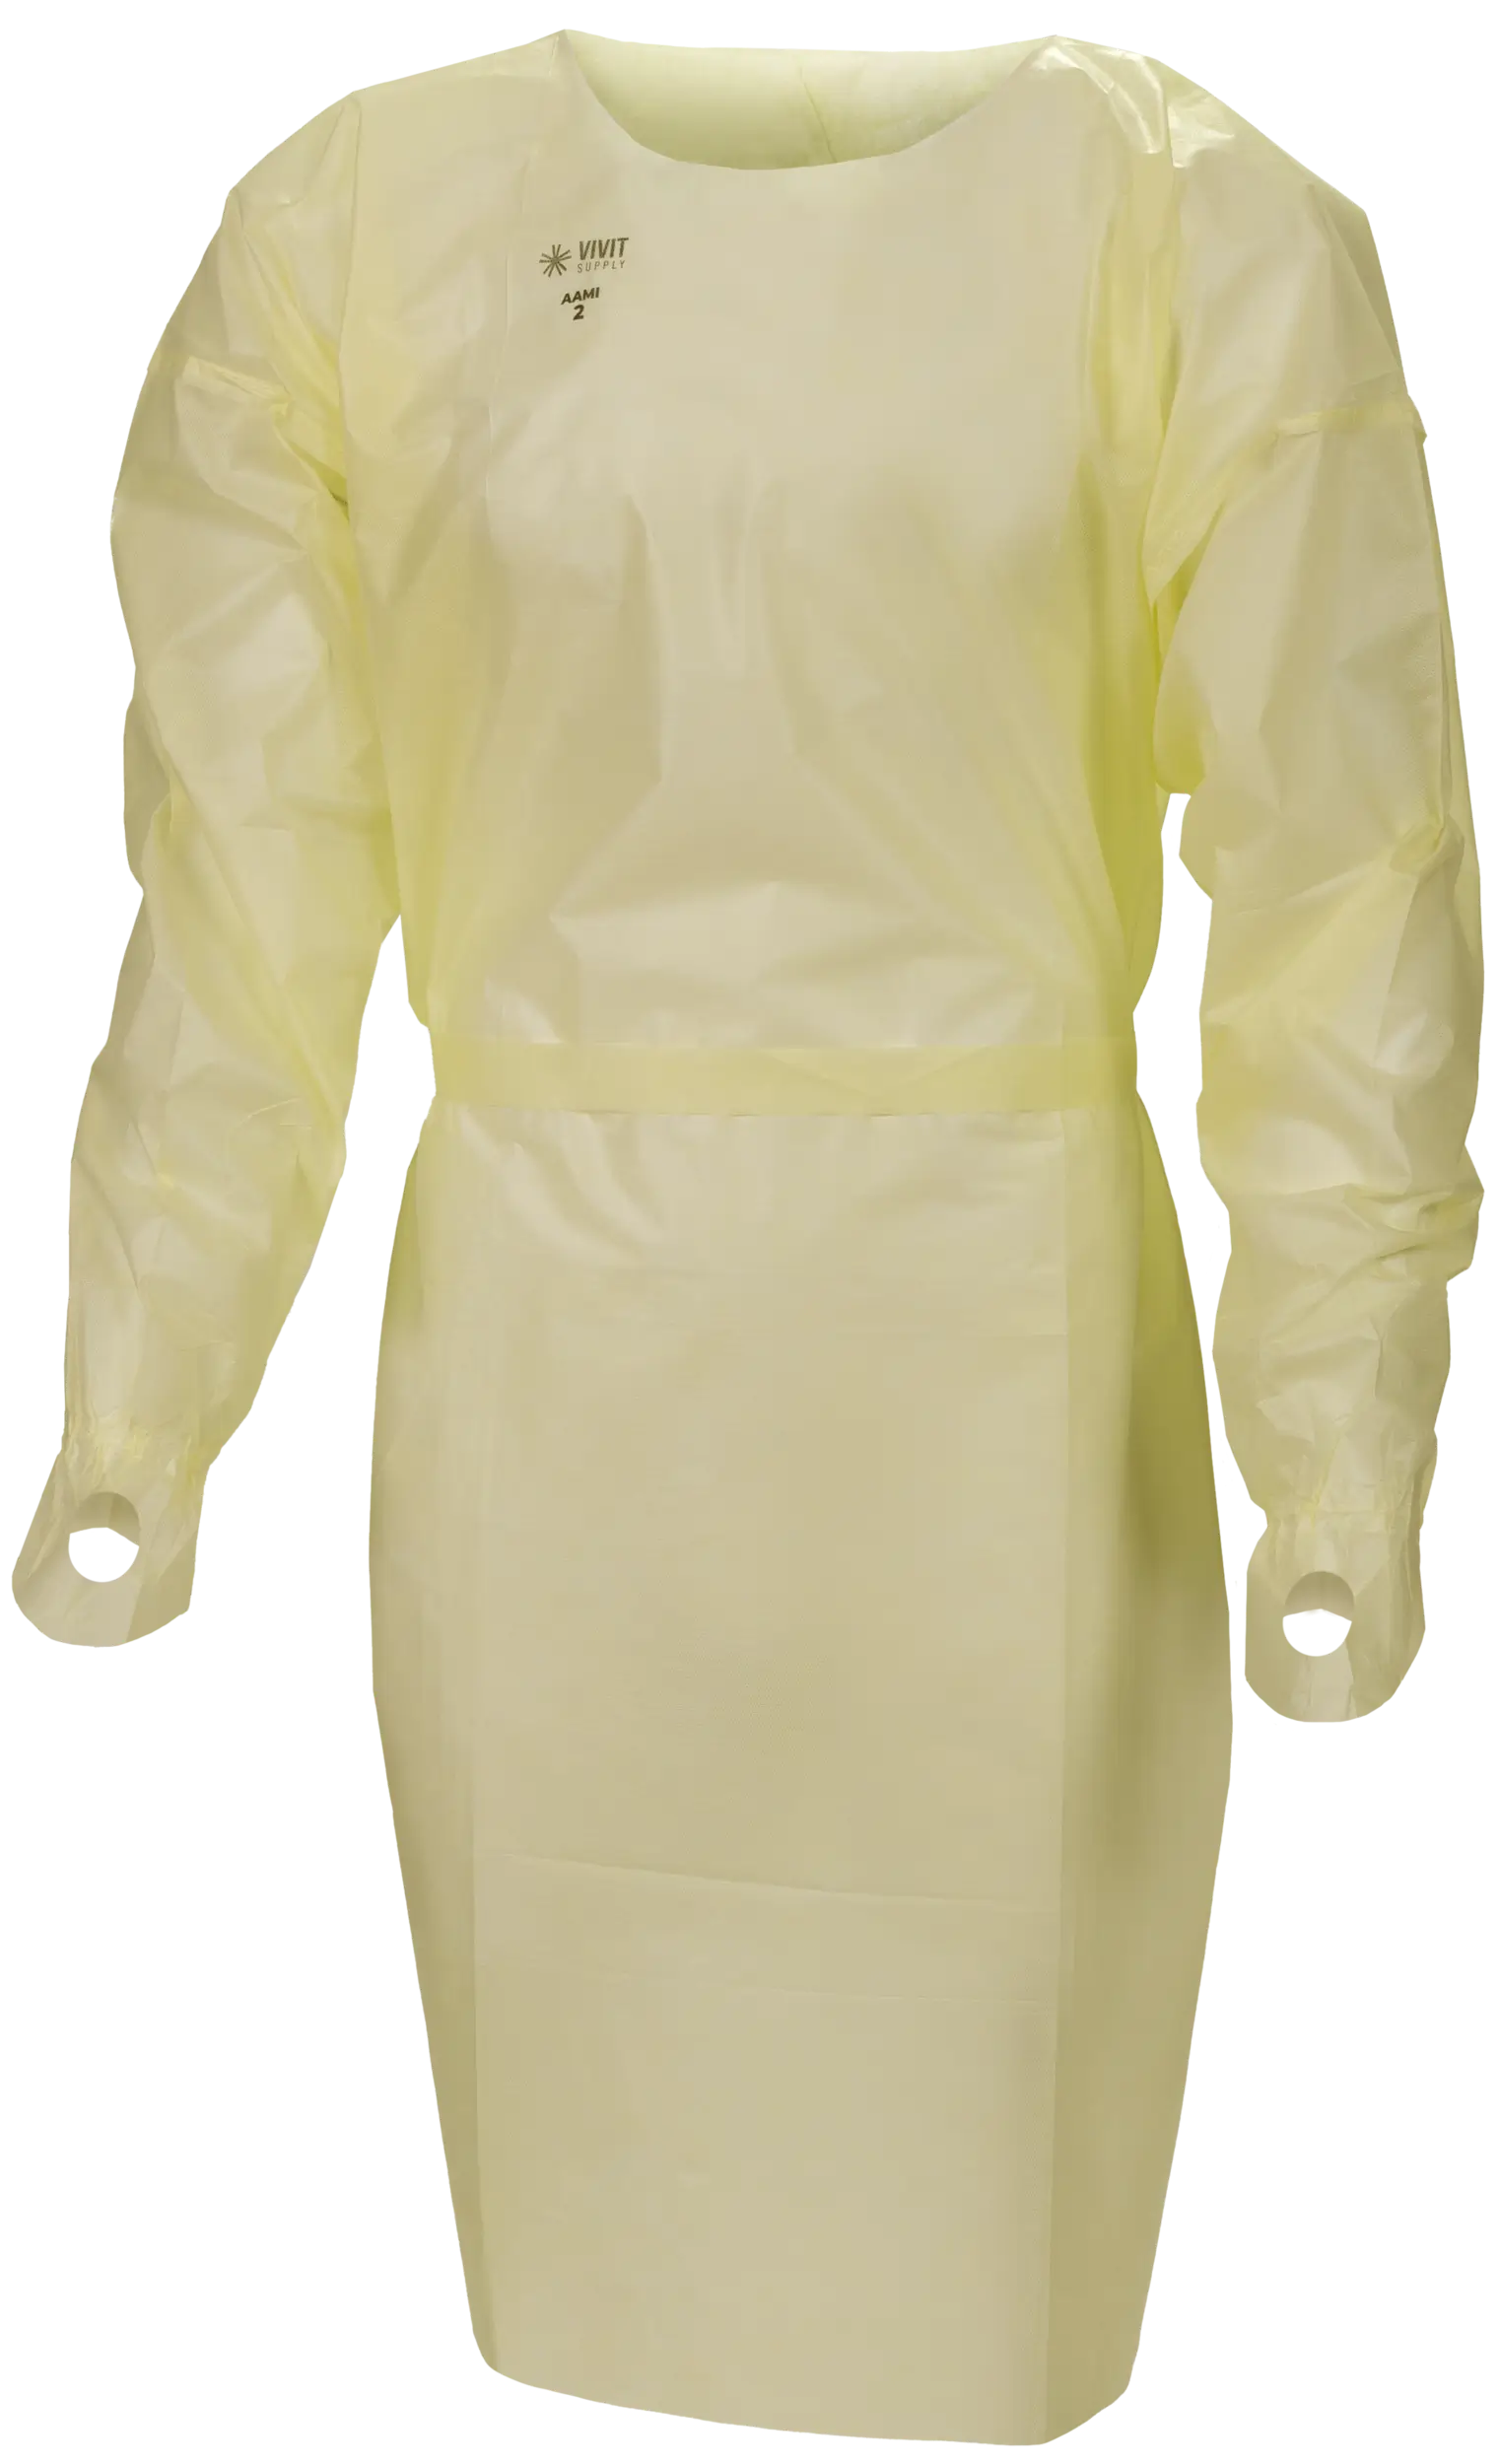
During flu season, average mask use increases by about 25%, isolation gown use by 17%, and glove use by 1%. Given the already high volume of gloves used, even a 1% increase can represent significant additional demand.
Face masks
+25%vs. standard monthsIsolation gowns
+17%vs. standard monthsExam gloves
+1%vs. standard monthsPreparing Your Health System
Check the signals weekly
Review key flu indicators in your area, like ARI %, ILI visits, admissions and wastewater, every Friday, and how they’re affecting your patient traffic and PPE usage.
Forecast from flu signals
Adjust orders on key SKUs as activity rises. Don’t rely on last year’s usage alone. Start with the categories that get hit hardest, including facial protection and isolation gowns.
Talk to your supplier
Share your usage trends with your supplier and ask about inventory reserved in case the season peaks harder than expected.
Get this update every Friday
Cut through the noise and stay in the loop on what’s happening with the flu season.
- 1CDC FluView, week 41 (ending Oct 17, 2026). Flu-like illness (ILI) visits, strain shares and vaccine match. Published Oct 23, 2026. Data are preliminary.
- 2CDC National Wastewater Surveillance System (NWSS), National Wastewater Data. Influenza A wastewater viral activity level (WVAL), national and by state (used for the card and the map). How it’s calculated: CDC’s guide to Wastewater Viral Activity Levels. Data: CDC Wastewater Viral Activity Level for SARS-CoV-2, Influenza A and RSV.
- 3CDC Respiratory Virus Activity Levels: Acute Respiratory Illness (ARI). Percent of emergency department visits for acute respiratory illness and CDC’s activity levels, from the National Syndromic Surveillance Program (NSSP). Data: NSSP Emergency Department Respiratory Daily and Level of ARI Activity by State.
- 4CDC National Healthcare Safety Network (NHSN), Weekly Hospital Respiratory Data. New hospital admissions with lab-confirmed influenza per 100,000 people, with CDC’s Hospital Admissions Levels. Averages compare the same week in recent seasons; 2024–25 is excluded because hospital reporting was voluntary. Methods: CDC’s Hospital Respiratory Data (HRD) Methodology.
- 5FDA, Influenza Vaccine Composition for the 2026–27 U.S. Season. Vaccine strains selected for this season.
- 6CDC FluVaxView, Influenza Vaccination Coverage for All Ages (6+ Months). End-of-season (May) flu vaccination coverage for people 6 months and older, United States. 2023–24 is from CDC’s 2023–24 season report, since that season is missing from the dataset.
- 7CDC, 2026–2027 Flu Season. Manufacturers’ projected U.S. flu vaccine supply for the 2026–27 season. Prior season: CDC Seasonal Influenza Vaccine Supply FAQ (154 million doses projected for 2025–26).
- 8CDC ILI Activity Indicator Map. State flu-like illness activity levels, grouped from CDC’s 13 levels into 5.
- 9Clarivate PPE utilization data, 2017–2025. Average change in face mask, isolation gown and exam glove use during flu season vs. standard months.
The VIVIT Supply Flu Season Tracker is provided for general informational purposes only and does not constitute medical advice. Data are compiled from publicly available sources, including the U.S. Centers for Disease Control and Prevention (CDC) and state and local health departments, as of the dates shown, and may be incomplete, delayed, revised, or not directly comparable across jurisdictions. "Insufficient Data" does not indicate an absence of influenza activity. Use of this data does not imply endorsement by the CDC, HHS, or any government agency of VIVIT Supply or its products. Information is provided "as is" without warranty of any kind. Consult a healthcare professional or your local public health authority for guidance.